How to Solve Assignments on Advanced Statistics for Data Science Specialization
.svg)
Claim Your Discount Today
Get 10% off on all Statistics homework at statisticshomeworkhelp.com! Whether it’s Probability, Regression Analysis, or Hypothesis Testing, our experts are ready to help you excel. Don’t miss out—grab this offer today! Our dedicated team ensures accurate solutions and timely delivery, boosting your grades and confidence. Hurry, this limited-time discount won’t last forever!
We Accept


- The Foundation: Probability and Expectation
- Understanding Conditional Probabilities
- Distributions and Sampling in Data Science
- Bootstrapping for Confidence Intervals
- Working with Binomial Proportions
- The Power of Linear Algebra in Regression Models
- Canonical Examples of Linear Models
- Hypothesis Testing and Statistical Inference
- Regression Analysis and Predictive Modeling
- Bayesian Statistics in Data Science
- Linking Biostatistics and Data Science
- Advanced Mathematical Modeling and Applied Statistics
- R Programming: The Core Analytical Tool
- Bringing It All Together: Solving a Complete Assignment
- Conclusion
In today’s era of data-driven innovation, the Advanced Statistics for Data Science Specialization stands out as one of the most in-demand academic paths for students pursuing statistics, computer science, and applied analytics. This specialization blends the mathematical rigor of probability, statistical inference, and regression with the computational power of R programming, enabling learners to analyze real-world datasets and make data-backed decisions. Students often encounter challenging assignments involving probability distributions, hypothesis testing, sampling, and multivariate regression — all requiring a deep understanding of both theory and practical implementation. At statisticshomeworkhelper.com, our team of experts provides trusted statistics homework help to guide students through these complex topics with clarity and precision. Whether it’s mastering conditional probabilities, computing confidence intervals, or interpreting regression outputs, our experts ensure that every concept is understood thoroughly. We also assist learners seeking help with data science homework, offering tailored solutions that integrate statistical reasoning with computational techniques. Through personalized tutoring and step-by-step guidance, students not only complete their assignments accurately but also strengthen their analytical thinking skills, preparing them for advanced work in biostatistics, predictive modeling, and data-driven research across various domains.
The Foundation: Probability and Expectation

Assignments in this specialization often start with probability theory, the backbone of all statistical reasoning. You’ll encounter tasks asking you to compute the probability of certain outcomes, conditional probabilities, or expected values.
Key Topics to Master
- Probability distributions: Normal, Binomial, Poisson, and Exponential distributions.
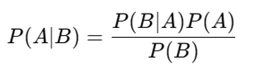
- Conditional probability: ( P(A|B) = P(A∩B)/PB— fundamental for understanding dependencies between variables.
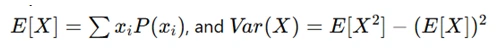
Expectation and variance:
Assignment Approach
When solving such problems:
- Identify the type of distribution being used in the question.
- Use R functions like dbinom(), pnorm(), qnorm(), or rpois() to calculate probabilities and cumulative values.
- Visualize distributions using histograms or density plots in R to interpret results intuitively.
For instance, to find the probability that a random variable ( X ) (normal distribution, mean = 50, sd = 10) exceeds 60:
1 - pnorm(60, mean = 50, sd = 10)
This command quickly computes the probability using R’s built-in normal distribution function.
Understanding Conditional Probabilities
Conditional probability questions test your understanding of dependency and uncertainty in data. You may be asked to compute posterior probabilities or interpret Bayes’ Theorem:
Example Assignment Problem
A test for a disease has a 95% sensitivity and 90% specificity. If 1% of the population has the disease, what is the probability that a person testing positive actually has the disease?
Solution Steps
- Define events:
- Apply Bayes’ Theorem:
D = disease present
T = test positive
( P(T|D) = 0.95 ), ( P(T∣¬D) = 0.10 ), ( P(D) = 0.01 ).
- Compute in R:
P_D_given_T <- (0.95*0.01) / ((0.95*0.01) + (0.10*0.99))
	P_D_given_T
Assignments like this strengthen your understanding of statistical reasoning in uncertainty, a key competency for data scientists.
Distributions and Sampling in Data Science
Assignments also focus heavily on sampling and probability distributions because they form the bridge between theoretical probability and real-world data analysis.
Important Concepts
- Sampling distribution of a statistic (e.g., mean or proportion)
- Central Limit Theorem (CLT) – states that the sampling distribution of the mean approaches normality as the sample size grows, regardless of the population’s distribution.
- Confidence Intervals (CIs) – provide an estimated range of values likely to include the population parameter.
Practical Example
Compute the 95% confidence interval for the mean of a sample dataset.
In R:
data <- c(45, 50, 55, 60, 65)
	mean_val <- mean(data)
	sd_val <- sd(data)
	n <- length(data)
	error <- qt(0.975, df=n-1) * sd_val / sqrt(n)
	CI <- c(mean_val - error, mean_val + error)
	CI
This approach is vital for inferential statistics, helping students make population-level conclusions from sample data.
Bootstrapping for Confidence Intervals
Bootstrapping is an advanced resampling technique often featured in this specialization. Instead of relying on parametric assumptions, it estimates confidence intervals empirically.
Assignment Use Case
Estimate the 95% confidence interval of the mean using bootstrapping.
In R:
set.seed(123)
	data <- c(10, 20, 30, 40, 50)
	boot_means <- replicate(1000, mean(sample(data, replace=TRUE)))
	quantile(boot_means, c(0.025, 0.975))
This simulation approach is crucial in biostatistics and data science, where data may not follow ideal theoretical distributions.
Working with Binomial Proportions
Assignments related to binomial proportions focus on estimating probabilities in binary outcomes (success/failure, yes/no).
For example:
Compute the 95% confidence interval for a binomial proportion where 40 successes are observed in 100 trials.
In R:
prop.test(40, 100, conf.level=0.95)
This helps students apply inferential logic in scenarios like survey analysis, A/B testing, or clinical trials.
The Power of Linear Algebra in Regression Models
At the heart of advanced statistical assignments lies matrix algebra, which forms the mathematical framework for linear regression models.
Linear Regression in Matrix Form
The general model:
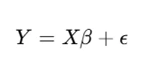
where:
- ( Y ): dependent variable vector
- ( X ): design matrix (independent variables)
- β: vector of coefficients
- ϵ: error term
The least squares estimate is:

Understanding this equation allows students to interpret regression modeling from both mathematical and computational perspectives.
In R, regression can be solved as:
X <- as.matrix(cbind(1, c(1,2,3,4,5)))
	Y <- as.matrix(c(2,4,6,8,10))
	beta_hat <- solve(t(X)%*%X)%*%t(X)%*%Y
	beta_hat
This manual computation complements the use of built-in functions like lm(), giving learners deeper insights into the mechanics of regression analysis.
Canonical Examples of Linear Models
Assignments also involve understanding canonical models like:
- Simple Linear Regression
- Multiple Linear Regression
- Logistic Regression
- Multivariate Linear Models
Each model builds upon the core understanding of variance, estimation, and prediction.
For instance:
model <- lm(Y ~ X1 + X2, data = dataset)
	summary(model)
The output includes coefficients, R-squared, p-values, and confidence intervals, all of which must be interpreted in your report.
When solving such questions:
- Start with data exploration (check for outliers and missing values).
- Fit the model using R.
- Interpret coefficients to explain relationships.
- Evaluate model accuracy using residual plots and diagnostics.
Hypothesis Testing and Statistical Inference
Hypothesis testing is another essential part of this specialization. Assignments may ask students to test whether a parameter differs significantly from a hypothesized value.
Common Tests
- t-tests (for means)
- z-tests (for large samples)
- Chi-square tests (for independence)
- ANOVA (for comparing multiple means)
Example
Test whether the mean weight of a sample differs from 70 kg.
t.test(data, mu = 70)
Key steps include:
- Formulating null ((H_0)) and alternative ((H_1)) hypotheses.
- Calculating the test statistic.
- Comparing p-values with significance levels.
Assignments often require clear interpretation of results — not just computation. You must state whether to reject or fail to reject the null hypothesis, providing a contextual explanation.
Regression Analysis and Predictive Modeling
As you progress through this specialization, you’ll encounter regression-based predictive modeling assignments. These link statistical inference with machine learning applications.
Example
Build a model predicting sales using advertising data.
model <- lm(Sales ~ TV + Radio + Newspaper, data = ads)
	summary(model)
You may be asked to interpret:
- Coefficients: Impact of each predictor
- R-squared: Proportion of variance explained
- Residual diagnostics: Model adequacy
Further, advanced assignments may require the use of regularization methods like Lasso or Ridge regression to handle multicollinearity or overfitting.
Bayesian Statistics in Data Science
Modern data science increasingly leverages Bayesian methods for probabilistic inference. Assignments may ask you to update prior beliefs with data evidence using Bayes’ Theorem.
Example
# Prior: Beta(2,2)
	# Data: 8 successes out of 10
	posterior_alpha <- 2 + 8
	posterior_beta <- 2 + 2
	posterior_mean <- posterior_alpha / (posterior_alpha + posterior_beta)
	posterior_mean
This approach is useful in predictive analytics, especially in applications involving uncertainty and dynamic data updates.
Linking Biostatistics and Data Science
Assignments under this specialization frequently combine biostatistical applications (like case-control studies or sampling designs) with data science computation.
A typical assignment might involve:
- Designing a stratified sample.
- Calculating likelihood ratios.
- Conducting logistic regression on health-related data.
Here’s how you might perform logistic regression in R:
model <- glm(Disease ~ Age + BMI + Smoking, data = health_data, family = binomial)
	summary(model)
Students are expected to interpret the odds ratios and understand the statistical significance of predictors.
Advanced Mathematical Modeling and Applied Statistics
In advanced assignments, you might be required to formulate mathematical models that simulate real-world phenomena. These could involve:
- Population growth models.
- Disease spread models.
- Market prediction models.
Each involves the combination of probability theory, differential equations, and statistical inference to form predictive frameworks.
R Programming: The Core Analytical Tool
Throughout the specialization, R programming serves as the computational foundation. Whether you’re handling matrix operations, probability distributions, or regression analysis, R provides efficient functions and packages.
Common R Packages Used
- stats – core statistical functions
- boot – bootstrapping
- MASS – advanced linear models
- ggplot2 – data visualization
- car – regression diagnostics
A good practice is to annotate your R code and report interpretations clearly, ensuring that your statistical reasoning is transparent and reproducible.
Bringing It All Together: Solving a Complete Assignment
A comprehensive assignment in Advanced Statistics for Data Science Specialization may involve multiple steps:
- Define the research question and hypotheses.
- Collect or simulate data in R.
- Apply statistical methods — probability, regression, inference.
- Validate models using diagnostics.
- Interpret results in context (not just statistically).
- Visualize outcomes for clear presentation.
Assignments at this level test your conceptual depth, analytical skill, and programming precision.
If you find such assignments challenging, the experts at StatisticsHomeworkHelper.com can assist with conceptual understanding, R implementation, and model interpretation — ensuring you grasp both the why and the how behind your solutions.
Conclusion
The Advanced Statistics for Data Science Specialization provides the essential mathematical and computational framework that drives modern data science. From probability and bootstrapping to regression and Bayesian inference, every concept contributes to your ability to draw insights from data.
However, due to the mathematical rigor and programming requirements, many students struggle to connect the theory with application. At StatisticsHomeworkHelper.com, our experienced statisticians simplify these complexities, helping you solve assignments efficiently while mastering the principles that power data-driven decision-making.
Whether you’re working on biostatistics, probability distributions, sampling theory, or linear regression modeling, remember that understanding the logic behind each concept is the true key to success.