How to Solve Quality Control Assignments with Statistical Methods
.webp)
Claim Your Discount Today
Get 10% off on all Statistics homework at statisticshomeworkhelp.com! Whether it’s Probability, Regression Analysis, or Hypothesis Testing, our experts are ready to help you excel. Don’t miss out—grab this offer today! Our dedicated team ensures accurate solutions and timely delivery, boosting your grades and confidence. Hurry, this limited-time discount won’t last forever!
We Accept


- Understanding Control Charts
- Setting Control Limits
- Probability of Detecting Process Shifts
- Average Run Length (ARL)
- Process Capability Analysis
- Gauge Repeatability and Reproducibility (GR&R)
- Constructing Control Charts for Future Production
- Conclusion
Quality control assignments can be challenging, requiring a deep understanding of statistical process control, capability analysis, and measurement system evaluation. Whether you're dealing with control charts, process variability, or gauge repeatability, a structured approach is essential for accurate analysis. Many students seek statistics homework help to grasp these concepts effectively and apply them in their assignments. Solving such tasks involves interpreting control limits, detecting shifts in process data, and understanding key quality indices like Cp and Cpk. Additionally, probability-based measures like the Average Run Length (ARL) help determine the responsiveness of a control system to process variations. Assignments in this domain often require recalculating control limits when sample sizes change, adjusting statistical models to accommodate production modifications, and assessing the precision of measurement tools. If you need help with statistical quality control homework, it's crucial to focus on fundamental statistical principles and their application in real-world quality assurance processes. Understanding repeatability and reproducibility, for instance, ensures that measurement systems remain reliable, minimizing errors in industrial processes. By mastering these theoretical aspects, students can confidently analyze production data, identify anomalies, and recommend improvements in manufacturing quality management.
Understanding Control Charts

Control charts are essential tools in statistical quality control, helping to monitor and maintain process stability over time. They are graphical representations of process data that allow analysts to identify variations and detect potential issues before they lead to defects. There are various types of control charts, such as p-charts for proportion defective, c-charts for count-based defects, and u-charts for defect rates in varying sample sizes. The fundamental concept behind control charts is the establishment of upper and lower control limits (UCL and LCL), which indicate the expected range of process variation. When data points remain within these limits, the process is considered stable, while points outside suggest assignable causes requiring investigation. Control charts also help in distinguishing between common cause variation, which is inherent in any process, and special cause variation, which results from specific disruptions. By continuously analyzing these charts, quality managers can make informed decisions, improve process efficiency, and ensure compliance with quality standards. Control charts are statistical tools used to monitor process stability over time. Depending on the nature of the data, different types of control charts are used:
- p-Charts: Monitor the fraction of defective units in a process.
- c-Charts: Track the number of defects in a fixed sample size.
- u-Charts: Assess defects per unit when sample sizes vary.
Setting Control Limits
To construct control charts, upper and lower control limits (UCL and LCL) must be determined. These limits are usually calculated using three-sigma limits:
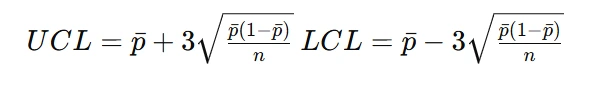
where:
- pˉ is the process average.
- n is the sample size.
A process is considered stable if all data points fall within these limits. If an outlier appears, assignable causes must be investigated.
Probability of Detecting Process Shifts
Control charts are essential tools in statistical quality control, helping to monitor and maintain process stability over time. They are graphical representations of process data that allow analysts to identify variations and detect potential issues before they lead to defects. There are various types of control charts, such as p-charts for proportion defective, c-charts for count-based defects, and u-charts for defect rates in varying sample sizes. The fundamental concept behind control charts is the establishment of upper and lower control limits (UCL and LCL), which indicate the expected range of process variation. When data points remain within these limits, the process is considered stable, while points outside suggest assignable causes requiring investigation. Control charts also help in distinguishing between common cause variation, which is inherent in any process, and special cause variation, which results from specific disruptions. By continuously analyzing these charts, quality managers can make informed decisions, improve process efficiency, and ensure compliance with quality standards. Control charts are statistical tools used to monitor process stability over time. Depending on the nature of the data, different types of control charts are used: If a process average shifts from its expected value (e.g., from 0.07 to 0.10 in a p-chart), the probability of detection depends on the sensitivity of the control chart. The probability of detecting an out-of-control condition is given by:
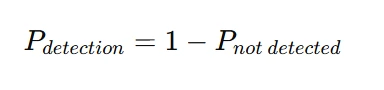
Understanding this probability helps in determining how quickly an operator can respond to process deviations.
Average Run Length (ARL)
The Average Run Length (ARL) is a key performance metric in quality control that represents the expected number of samples taken before an out-of-control signal is detected. ARL is inversely related to the probability of detection; a high ARL indicates that a control chart is slow in signaling process changes, while a low ARL suggests a more responsive system. Ideally, an effective control chart should have a high ARL when the process is in control to minimize false alarms and a low ARL when a shift occurs to ensure timely detection. The ARL calculation helps quality engineers optimize control chart parameters, such as control limits and sampling intervals, to balance sensitivity and stability in monitoring process performance. The ARL is the expected number of samples taken before an out-of-control signal occurs. It is calculated as:
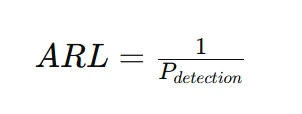
A higher ARL indicates that the process is less sensitive to changes, while a lower ARL suggests faster detection.
Process Capability Analysis
Process capability analysis assesses whether a manufacturing process meets specified tolerances by evaluating its variability relative to design limits. This involves calculating indices such as Cp and Cpk, which measure how well a process fits within upper and lower specification limits. A Cp value greater than 1.33 indicates a capable process, while a lower value suggests that variability may lead to defects. Cpk, on the other hand, considers both process variation and centering by comparing the distance between the process mean and specification limits. If Cpk < 1, the process may not consistently meet quality standards. Analyzing these indices allows manufacturers to identify areas for improvement, implement corrective actions, and ensure products meet customer expectations consistently. Process capability indices, such as Cp and Cpk, assess whether a process meets specifications. These indices are defined as:
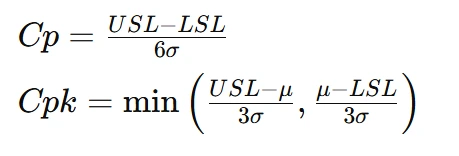
where:
- USL and LSL are upper and lower specification limits.
- μ is the process mean.
- σ is the standard deviation.
A process with Cp>1.33 is considered capable, while a lower value indicates potential issues.
Gauge Repeatability and Reproducibility (GR&R)
GR&R is a critical aspect of quality control that evaluates the reliability of measurement systems by assessing variability caused by operators, instruments, and environmental factors. Repeatability refers to variation when the same operator measures the same item multiple times, while reproducibility measures differences when multiple operators take the same measurements. A high GR&R percentage (above 30%) indicates an unreliable measurement system, requiring recalibration or training. If measurement errors exceed product tolerance limits, decisions based on such data could lead to false rejections or acceptance of defective products. Conducting a proper GR&R study helps maintain accuracy and reduces the likelihood of costly production errors.
To ensure measurement systems are reliable, variance components must be analyzed:
- Repeatability: Variability when the same operator measures the same item multiple times.
- Reproducibility: Variability when different operators measure the same item.
Total measurement system variability is expressed as:
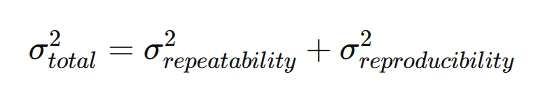
A high measurement variation suggests poor gauge reliability, necessitating recalibration.
Constructing Control Charts for Future Production
When production parameters change, such as increasing sample sizes or modifying measurement units, control charts must be adjusted to reflect new conditions. New UCL (Upper Control Limit) and LCL (Lower Control Limit) values must be recalculated to ensure process stability remains within acceptable variation. For example, transitioning from a 2000m to a 3000m sample size requires recalibrating control charts to maintain their sensitivity to shifts and trends. If sampling strategies are not updated, out-of-control signals might be misinterpreted, leading to incorrect process adjustments. Using real-time data and continuous monitoring, companies can optimize production efficiency and minimize variations.
Conclusion
Solving quality control assignments requires a strong understanding of statistical techniques, including process capability analysis, GR&R, and control chart adjustments. Mastering these concepts allows students to analyze manufacturing data effectively, detect deviations, and implement corrective actions to enhance quality standards. By applying these principles, students can gain a competitive edge in industrial quality management and develop the expertise needed to handle real-world quality control challenges.