How to Approach Multiple Regression Analysis Assignments in R

Claim Your Discount Today
Get 10% off on all Statistics homework at statisticshomeworkhelp.com! Whether it’s Probability, Regression Analysis, or Hypothesis Testing, our experts are ready to help you excel. Don’t miss out—grab this offer today! Our dedicated team ensures accurate solutions and timely delivery, boosting your grades and confidence. Hurry, this limited-time discount won’t last forever!
We Accept


- Understanding the Research Question
- Selecting Variables for the Model
- Data Exploration and Preparation
- Model Specification and Assumptions
- Estimating and Interpreting the Model
- Evaluating Model Fit and Robustness
- Drawing Conclusions
- Conclusion
Multiple regression analysis is a crucial statistical technique that allows researchers to examine the relationship between a dependent variable and multiple independent variables, making it an essential component of many academic assignments. When tackling such assignments, students often seek statistics homework help to navigate complex data sets, variable selection, and model interpretation. A well-structured approach to solving these assignments involves defining a clear research question, identifying appropriate variables, and ensuring the dataset is properly prepared before running regression models in R. Since R is a powerful tool for statistical computing, understanding its functionalities is vital for obtaining accurate results and meaningful interpretations. Conducting exploratory data analysis, checking for missing values, and ensuring the chosen model adheres to key OLS assumptions such as linearity, homoscedasticity, and the absence of multicollinearity is critical to producing robust findings. Beyond just running the lm() function in R, students must analyze outputs carefully, focusing on coefficient estimates, p-values, and help with R programming homework to ensure statistical significance and correct interpretations. Additionally, model diagnostics, including residual analysis and variance inflation factors, play a crucial role in validating results and avoiding misleading conclusions. Many students struggle with these technical aspects, making professional guidance highly beneficial in ensuring their assignments meet academic standards. Writing a well-structured regression analysis report requires not only statistical proficiency but also clarity in presenting results, discussing limitations, and drawing logical conclusions. Whether working with real-world datasets like the 2020 American National Election Study (ANES) or other sources, following best practices in statistical modeling is key to academic success. By breaking down the process into manageable steps, students can efficiently complete multiple regression assignments while developing a deeper understanding of statistical research methodologies.
Understanding the Research Question

Every multiple regression assignment begins with defining a clear research question. The research question should focus on identifying and explaining variations in the dependent variable. For instance, in the given assignment, the data comes from the 2020 American National Election Study (ANES), meaning the research question might revolve around predicting voter behavior or political preferences. It is crucial to establish a causal framework by theorizing how the independent variable(s) influence the dependent variable.
Selecting Variables for the Model
Choosing the right variables is crucial for building a reliable regression model. The dependent variable should be either continuous or dichotomous, while the independent variable should have a logical connection to it. Control variables help mitigate confounding effects, ensuring a more accurate representation of relationships. The selection process should be backed by theoretical reasoning rather than arbitrary choices, ensuring statistical integrity and meaningful interpretations.
A multiple regression model requires:
- Dependent variable (DV): The primary variable of interest, which is either continuous or dichotomous.
- Independent variable (IV): The key predictor variable that is hypothesized to influence the DV.
- Control variables: Additional variables included to account for confounding effects.
The selection of variables should be theory-driven rather than arbitrary. For example, if the research question pertains to voter turnout, the DV could be whether a person voted (binary: 1 = voted, 0 = did not vote), with IVs such as political interest, age, or income. Control variables might include education level and past voting behavior.
Data Exploration and Preparation
Before running the regression model, it is essential to explore the dataset for completeness and consistency. This includes conducting descriptive statistics, checking for missing values, and performing data transformations if necessary. Visualization techniques such as histograms and scatterplots help detect anomalies, while standardizing variables ensures comparability across different scales. Addressing these issues enhances the reliability of regression outcomes.
Before running a regression model, it is essential to explore the dataset. This step includes:
- Descriptive statistics: Summarizing the mean, median, standard deviation, and range of variables.
- Data visualization: Using histograms, boxplots, and scatterplots to check distributions and potential outliers.
- Checking for missing values: Handling missing data through imputation or exclusion.
- Variable transformations: If necessary, categorical variables should be converted into dummy variables, and skewed variables should be transformed.
Model Specification and Assumptions
Once variables are selected and the dataset is prepared, the next step is specifying the OLS regression model:
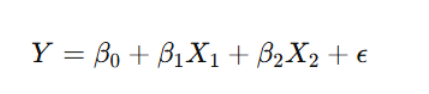
where Y is the dependent variable, X represents independent variables, and ϵ\epsilonϵ is the error term. Key assumptions include linearity, independence, homoscedasticity, and the absence of multicollinearity. Ensuring these conditions are met enhances model validity and accuracy.
Key assumptions of OLS regression include:
- Linearity: The relationship between independent and dependent variables should be linear.
- Independence: Observations should not be correlated.
- Homoscedasticity: The variance of errors should remain constant across all levels of the independent variable.
- No multicollinearity: Independent variables should not be highly correlated.
Estimating and Interpreting the Model
After running the regression model in R using the lm() function, it is important to interpret the coefficient estimates, p-values, and adjusted R2R^2R2 values. A statistically significant coefficient suggests a meaningful relationship, while an insignificant one indicates a weak or non-existent effect. Careful interpretation of these values helps determine whether the hypothesis is supported. Once the regression model is estimated in R using the lm() function, results need to be interpreted carefully. Important components include:
- Coefficient estimates: The sign, magnitude, and statistical significance (p-values) of coefficients help determine the strength and direction of relationships.
- Adjusted R2R^2: Explains the proportion of variance in the dependent variable explained by the model.
- Standard errors: Indicate the variability in coefficient estimates.
- F-statistic: Tests the overall significance of the model.
Evaluating Model Fit and Robustness
Assessing model performance involves checking diagnostic measures such as residual plots, variance inflation factors (VIF), and Cook’s distance. Residual analysis helps detect patterns of heteroscedasticity, while VIF ensures that independent variables are not highly correlated. Identifying outliers and influential data points prevents distorted results and improves overall model robustness.
Regression diagnostics are necessary to validate model assumptions and reliability. Some checks include:
- Residual plots: Checking for patterns to detect heteroscedasticity.
- Variance Inflation Factor (VIF): Ensuring multicollinearity is not an issue.
- Leverage and influence statistics: Identifying influential data points that may distort the model.
Drawing Conclusions
The final step involves summarizing findings in a structured manner. Discussion should include whether the hypothesis is supported, how control variables impact results, and the implications of findings. Addressing study limitations, such as data constraints or omitted variables, enhances the credibility of the research. Proposing future research directions adds value to the analysis. The final step involves summarizing findings in a clear and concise manner. The discussion should:
- Address whether results support the research hypothesis.
- Consider the inclusion or exclusion of variables.
- Identify limitations such as potential omitted variables or data biases.
- Suggest avenues for further research or alternative modeling approaches.
Conclusion
Successfully completing a multiple regression assignment requires a systematic approach, from defining the research question to interpreting results. By selecting appropriate variables, verifying assumptions, and ensuring statistical robustness, students can derive meaningful insights from their data. Adhering to best practices in regression modeling enhances academic performance and deepens the understanding of statistical techniques.