Solving Life-Contingent Investment Assignments in Statistics

Claim Your Discount Today
Get 10% off on all Statistics homework at statisticshomeworkhelp.com! Whether it’s Probability, Regression Analysis, or Hypothesis Testing, our experts are ready to help you excel. Don’t miss out—grab this offer today! Our dedicated team ensures accurate solutions and timely delivery, boosting your grades and confidence. Hurry, this limited-time discount won’t last forever!
We Accept


- The Core Idea of the Assignment
- Step 1: Understanding the Population and Survival Assumptions
- Step 2: Structuring the Cash Flows
- Step 3: Introducing Interest Rate Uncertainty
- Step 4: Modeling Group Behavior and Risk Pooling
- Step 5: Constructing the Analytical Framework
- Step 6: Answering the Assignment's Strategic Questions
- Step 7: Summary and Writing the Report
- Conclusion
Actuarial and investment-focused statistical assignments that simulate real-life decision-making under uncertainty are becoming a staple in modern finance and statistics coursework. These assignments often combine survival probabilities, collective investment schemes, stochastic interest rates, and basic simulation methods—requiring not only solid statistical understanding but also strong reasoning and strategic modeling skills.
In this blog, we provide a comprehensive and theoretical blueprint for solving a common but intellectually demanding type of assignment: evaluating the performance of a group-based life-contingent investment product. The structure, assumptions, and risks of this type of investment are similar to those found in life insurance, pensions, and tontines. The emphasis here is on the thought process, the statistical backbone, and the analytical expectations, rather than on the coding or final numerical answers.
Imagine a group of individuals contributing to a communal investment fund over a fixed period. The twist? The final returns are only distributed among those still alive at the end of the term. This “survivorship bonus” reflects a key actuarial concept: mortality credits, where gains are redistributed among survivors.
The fundamental structure includes:
The Core Idea of the Assignment
- A group of participants from different age cohorts.
- Periodic contributions over a fixed term.
- A probabilistic survival model.
- Investment returns following a random interest process.
- Redistribution of final value among surviving members.
This model mirrors real-world problems where longevity risk, collective investment, and stochastic interest returns intersect.

Step 1: Understanding the Population and Survival Assumptions
Your first priority is to dissect the population setup:
- A uniform distribution across a defined age group (e.g., 100,000 individuals aged 30–49, with 5,000 in each age).
- Known mortality probabilities for each age from life tables.
Key statistical tools involved:
- Life table probabilities, denoted qx, give the probability of dying between age x and x+1.
- Survival probability over multiple years, which you derive using:
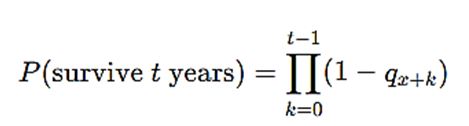
Each age group's expected participation at year 5 can be modeled using this multiplication chain. You don’t need to simulate every individual—model by cohorts instead, using average survival rates for groups of 5,000.
Step 2: Structuring the Cash Flows
The financial structure is defined simply:
- Each participant contributes a fixed amount (e.g., €1) every year for 5 years.
- The cumulative fund, with investment growth, is then redistributed among survivors.
Assumptions:
- Contributions are made annually, and are fixed.
- No one can withdraw; funds are forfeited if a participant dies before the payout year.
- The number of survivors determines the split of the total pool at maturity.
This structure leads to key questions:
- What is the expected return per age group?
- What is the risk of loss (i.e., contributing and dying before maturity)?
- How does group size affect outcomes?
Here, you apply expected value calculations, risk quantification, and scenario analysis.
Step 3: Introducing Interest Rate Uncertainty
To mimic real investment behavior, interest rates are introduced—but not as fixed percentages. Instead, they follow a random process, specifically modeled by an exponential distribution with a mean of 2% per year.
This adds another layer of complexity:
- Yearly fund growth is subject to probabilistic changes.
- Over 5 years, this creates a compounding effect, where earlier funds benefit more.
Theoretical insight: exponential distributions are memoryless, which simplifies multi-year modeling because each year’s rate is independent.
In your theoretical approach:
- Use Monte Carlo simulation concepts (conceptually, not coded) to describe variability.
- Emphasize how variance in returns increases the uncertainty in final payouts.
Step 4: Modeling Group Behavior and Risk Pooling
One of the most interesting aspects is the role of group size. The larger the group, the more predictable the outcomes due to the law of large numbers. Conversely, smaller groups introduce high variability and possible inequity in payouts.
You might model:
- Multiple scenarios (e.g., 5, 50, 500 participants).
- Varying age group distributions (all 30-year-olds vs. mixed 30–49).
Statistical takeaways:
- Pooling risk reduces individual uncertainty but doesn’t eliminate age-based discrepancies.
- The more homogeneous the age group, the easier it is to estimate expected returns fairly.
From a theoretical standpoint, you evaluate:
- Whether older participants are systematically disadvantaged.
- How small group volatility might cause unfair outcomes.
- Whether a threshold group size makes the scheme viable.
Step 5: Constructing the Analytical Framework
At this stage, your theoretical report or solution would include:
- Definitions of all variables and assumptions.
- A probabilistic model for survival.
- A financial model for fund accumulation.
- An analysis of different scenarios (e.g., varied interest, mortality, group sizes).
- Expected value and risk analysis for different age cohorts.
Avoid simple averages—they ignore survival probabilities and interest variability. Instead, emphasize:
- Expected returns conditional on survival.
- Distribution of returns under random interest.
- Probability of loss despite survival (due to unfavorable interest outcomes).
Step 6: Answering the Assignment's Strategic Questions
The core assignment often includes open-ended questions such as:
- What is the expected gain/loss for each age?
- Use survival probabilities and expected return modeling.
- Discuss the skewed return distribution: most people lose slightly or break even, some gain significantly.
- Is this investment advisable for all people?
- No—older participants face higher mortality and lower expected return.
- Younger participants have better odds, especially in small groups.
- Does group size impact outcome?
- Absolutely—larger groups average out individual randomness.
- In smaller groups, random deaths dramatically shift returns.
- How does the interest rate model affect results?
- Random interest adds volatility and can amplify both gains and losses.
- Survivors may benefit more in a high-interest trajectory.
Frame answers with nuance: “on average,” “conditional on survival,” and “subject to interest path variability.”
Step 7: Summary and Writing the Report
If your assignment demands a final report, your theoretical output should include:
- An executive summary: explaining the scheme and main findings.
- A modeling section: laying out survival models, investment assumptions, and group dynamics.
- A results/discussion section: exploring scenarios and risks.
- A recommendation: addressing who should invest and under what conditions.
Support your report with:
- Diagrams showing return distribution.
- Age-based expected returns table (conceptually).
- Charts explaining sensitivity to group size and interest variability.
Keep the report formal, logical, and focused on reasoning rather than numerical precision.
Conclusion
Assignments involving life-contingent investments challenge students to think across domains—blending actuarial modeling, probabilistic forecasting, and financial analysis. Success lies not in producing one set of “correct” numbers, but in constructing a rigorous, scenario-based model that explains outcomes and uncertainties.
By approaching such assignments through a layered, analytical lens—first demystifying the population dynamics, then structuring the financial mechanics, and finally integrating probabilistic investment paths—you not only meet the academic objectives but also acquire tools valuable in real-world actuarial and finance roles.