How to Solve Assignments on Statistics and Calculus Methods for Data Analysis
.webp)
Claim Your Discount Today
Get 10% off on all Statistics homework at statisticshomeworkhelp.com! Whether it’s Probability, Regression Analysis, or Hypothesis Testing, our experts are ready to help you excel. Don’t miss out—grab this offer today! Our dedicated team ensures accurate solutions and timely delivery, boosting your grades and confidence. Hurry, this limited-time discount won’t last forever!
We Accept


- Understanding the Role of Statistics and Calculus in Data Analysis
- Calculating Expected Values for Statistical Analysis
- Theoretical Concept
- Example Assignment Task
- Python Implementation
- Applying the Normal Distribution for Statistical Modeling
- Concept Overview
- Example Assignment Task
- Python Solution
- Key Skills Gained
- Performing Derivative Calculations for Optimization and Rate of Change Analysis
- Understanding Derivatives
- Applications in Data Analysis
- Python Example
- Solving Complex Integrals Using Python for Continuous Data Analysis
- Theoretical Concept
- Python Example
- Combining Statistical and Calculus Methods in Python for Predictive Modeling
- Example Assignment
- Python Implementation
- Practical Applications: Connecting Theory to Real Data
- Skills You’ll Gain from Such Assignments
- Tips for Excelling in Assignments Involving Statistics and Calculus
- Conclusion
In today’s data-driven academic landscape, solving assignments that integrate statistics and calculus has become a crucial skill for students pursuing degrees in data science, economics, computer science, and engineering. These assignments demand both theoretical understanding and practical proficiency in analytical tools like Python. Key concepts such as expected values, normal distribution, derivatives, and integrals are fundamental to uncovering patterns, optimizing models, and performing predictive analysis. Our statistics homework help experts assist students in mastering these complex topics by combining mathematical accuracy with computational efficiency. Whether it’s performing derivative-based optimization, computing probabilities using normal distribution, or applying integrals for continuous data analysis, we provide step-by-step guidance to ensure conceptual clarity and precise execution. Our goal is to help students connect mathematical concepts with real-world data applications through structured learning and problem-solving techniques. By availing help with data analysis assignment, students can effectively translate mathematical theory into actionable insights, develop stronger analytical reasoning, and gain confidence in tackling assignments that involve advanced calculus and statistical modeling. With expert mentoring and hands-on Python solutions, StatisticsHomeworkHelper.com ensures academic excellence in every aspect of statistical and calculus-based data analysis.
Understanding the Role of Statistics and Calculus in Data Analysis

Statistics and calculus are deeply intertwined in modern data analysis. While statistics provides the foundation for data summarization, inference, and prediction, calculus supports the optimization and modeling of complex relationships.
- Statistics helps describe data patterns, measure uncertainty, and make informed decisions.
- Calculus deals with change — rates, accumulations, and optimization — which are key in understanding how data evolves over time or across conditions.
Together, they enable data scientists and analysts to build predictive models, perform parameter estimation, and optimize outcomes using mathematical precision. When working on assignments that combine these fields, students are often asked to compute expected values, perform differentiation for rate analysis, and use integral calculus for probability density and continuous data modeling.
Calculating Expected Values for Statistical Analysis
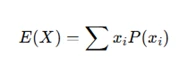
One of the fundamental tasks in statistics assignments is computing the expected value (EV), which represents the average or mean outcome of a random variable over many trials. It’s a measure of central tendency in probability and is used extensively in risk analysis, forecasting, and decision-making.
Theoretical Concept
For a discrete random variable ( X ) with possible outcomes ( x_1, x_2, ..., x_n ) and probabilities ( P(xi) ), the expected value is:
For continuous distributions:
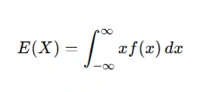
where ( f(x) ) is the probability density function (PDF).
Example Assignment Task
“Calculate the expected value of a random variable following a normal distribution with mean (μ= 50 ) and standard deviation (σ = 10 ).”
Here, the expected value of a normal distribution is simply the mean ( \mu ), hence ( E(X) = 50 ).
Python Implementation
import numpy as np
	mu = 50
	sigma = 10
	expected_value = mu
	print("Expected Value:", expected_value)
Students can further use Monte Carlo simulations to estimate expected values from empirical data.
Understanding expected values is crucial because it connects probability theory to statistical decision-making, forming the backbone of inferential analysis.
Applying the Normal Distribution for Statistical Modeling
The normal distribution, often called the Gaussian distribution, is a key concept in statistics. Many real-world phenomena — such as test scores, measurement errors, or financial returns — follow a roughly normal pattern.
Concept Overview
The probability density function (PDF) of a normal distribution is given by:
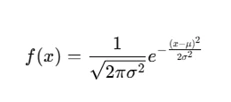
Assignments involving normal distribution often require calculating probabilities, confidence intervals, or using z-scores for hypothesis testing.
Example Assignment Task
“Find the probability that a randomly selected observation from a normal distribution with (μ = 100 ), (σ = 15 ) is less than 120.”
Python Solution
from scipy.stats import norm
	mu = 100
	sigma = 15
	prob = norm.cdf(120, mu, sigma)
	print("P(X < 120) =", prob)
This calculation shows how Python can automate probability calculations and data visualization using statistical libraries like SciPy or NumPy.
Key Skills Gained
- Probability distribution analysis
- Understanding data variability
- Estimating statistical significance
Through such assignments, students develop practical expertise in probability & statistics, data modeling, and applied mathematics.
Performing Derivative Calculations for Optimization and Rate of Change Analysis
Calculus becomes essential in data analysis when dealing with change, growth, or optimization problems. Derivatives help determine how one variable changes with respect to another — a critical concept in economics, physics, and machine learning.
Understanding Derivatives
The derivative of a function ( f(x) ) is:
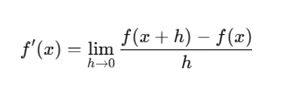
Applications in Data Analysis
- Optimization: Finding maxima/minima in cost, profit, or likelihood functions.
- Rate of Change: Measuring how a dependent variable changes with inputs (e.g., marginal cost, growth rate).
- Machine Learning: Computing gradients for optimization algorithms like gradient descent.
Python Example
import sympy as sp
	x = sp.Symbol('x')
	f = x**3 - 5*x**2 + 7*x - 3
	derivative = sp.diff(f, x)
	print("Derivative:", derivative)
This symbolic computation helps students visualize and compute analytical derivatives for optimization-based assignments.
When performing such analyses, remember:
- First derivatives help find slopes and rates.
- Second derivatives indicate curvature and identify maxima/minima.
These skills are directly applicable in mathematical modeling and data-driven optimization tasks.
Solving Complex Integrals Using Python for Continuous Data Analysis
Integral calculus allows analysts to compute areas under curves, cumulative quantities, and probability densities. In data science, integrals are used to find total expected outcomes, continuous averages, and distribution probabilities.
Theoretical Concept
For a continuous function ( f(x) ), the integral is:
Python Example
from scipy.integrate import quad
	import numpy as np
	f = lambda x: np.exp(-x**2)
	result, _ = quad(f, -np.inf, np.inf)
	print("Integral:", result)
This example evaluates the Gaussian integral, which equals ( \sqrt{\pi} ).
Integrals are particularly useful for:
- Finding total probabilities under continuous distributions
- Calculating expected values and variances
- Performing cumulative data analysis
Such tasks combine mathematical theory with computational analysis, strengthening students’ understanding of both calculus and data interpretation.
Combining Statistical and Calculus Methods in Python for Predictive Modeling
Assignments often culminate in applying both statistical and calculus techniques to develop predictive models. This involves constructing mathematical relationships, estimating parameters, and optimizing functions using data.
Example Assignment
“Build a predictive model to estimate house prices using statistical and calculus-based optimization methods.”
Approach:
- Statistical Modeling: Use regression to model relationships between predictors (e.g., size, location) and outcome (price).
- Calculus for Optimization: Apply derivatives to minimize the loss function (e.g., Mean Squared Error).
Python Implementation
import numpy as np
	# Example: Linear regression with gradient descent
	X = np.array([1, 2, 3, 4, 5])
	y = np.array([2, 4, 5, 4, 5])
	m, b = 0.0, 0.0
	lr = 0.01
	for _ in range(1000):
	y_pred = m*X + b
	dm = (-2/len(X)) * sum(X * (y - y_pred))
	db = (-2/len(X)) * sum(y - y_pred)
	m -= lr * dm
	b -= lr * db
	print(f"Model: y = {m:.2f}x + {b:.2f}")
This illustrates how derivatives and statistics combine for parameter estimation — a process central to machine learning and predictive analytics.
Key Concepts Reinforced:
- Regression modeling
- Gradient-based optimization
- Predictive data interpretation
By integrating statistical models with calculus-driven optimization, students develop the analytical mindset required for real-world data science.
Practical Applications: Connecting Theory to Real Data
Assignments often test a student’s ability to translate theory into practice. Below are a few examples where both statistics and calculus play a vital role.
| Application | Statistical Concept | Calculus Concept | Python Tool |
|---|---|---|---|
| Risk Assessment | Expected Value | Derivative for sensitivity | NumPy, SciPy |
| Economics | Regression, Variance | Optimization for profit maximization | Statsmodels |
| Machine Learning | Logistic Regression | Gradient Descent | Scikit-learn |
| Environmental Science | Distribution Analysis | Integration for cumulative change | Matplotlib, SymPy |
| Finance | Portfolio Variance | Partial Derivatives for returns | Pandas, NumPy |
These examples demonstrate how statistical analysis, mathematical modeling, and applied calculus converge in practical, interdisciplinary problem-solving.
Skills You’ll Gain from Such Assignments
By mastering assignments that combine statistics and calculus, students gain expertise in multiple areas crucial for modern data analysis:
- Statistical Analysis: Understanding distributions, variance, and hypothesis testing.
- Probability & Statistics: Applying theoretical models to real-world data.
- Mathematics and Mathematical Modeling: Developing analytical frameworks for predictions.
- Applied Mathematics: Using calculus and algebra in optimization problems.
- Statistical Modeling: Building regression and classification models.
- Integral & Differential Calculus: Measuring changes and cumulative effects.
- Data Science: Transforming raw data into actionable insights.
- Predictive Modeling: Forecasting trends using historical data.
- Algorithms & Machine Learning: Automating data-driven predictions through optimization.
- Mathematical Theory & Analysis: Strengthening problem-solving and reasoning skills.
These competencies prepare students for careers in data science, quantitative finance, economics, engineering, and AI research.
Tips for Excelling in Assignments Involving Statistics and Calculus
- Start with conceptual clarity – Ensure you understand the meaning of every formula before applying it.
- Use Python or R for computations – Automating calculations reduces human error and enhances reproducibility.
- Visualize your data – Graphs and plots often reveal trends not visible through equations alone.
- Break down problems – Large questions often contain smaller, solvable steps (e.g., compute derivative first, then apply optimization).
- Cross-verify results – Check numerical results against analytical solutions when possible.
- Document your approach – Clarity and reasoning are as important as the final answer in academic assignments.
By adopting these strategies, students can efficiently solve assignments while developing transferable analytical skills.
Conclusion
Assignments that involve statistics and calculus methods for data analysis reflect the interdisciplinary nature of modern analytics. From computing expected values to performing derivative-based optimizations and solving integrals in Python, these concepts form the backbone of data science and machine learning.
By combining mathematical reasoning with computational efficiency, students can uncover insights that drive innovation and informed decision-making. Whether you are a beginner or an advanced learner, mastering these tools will greatly enhance your analytical capability and career readiness.
For personalized support, reach out to our Statistics Homework Help Experts at StatisticsHomeworkHelper.com — your trusted partner for mastering complex statistical and mathematical assignments.