How to Solve Estimation Problems in Statistics Assignments
.webp)
Claim Your Discount Today
Get 10% off on all Statistics homework at statisticshomeworkhelp.com! Whether it’s Probability, Regression Analysis, or Hypothesis Testing, our experts are ready to help you excel. Don’t miss out—grab this offer today! Our dedicated team ensures accurate solutions and timely delivery, boosting your grades and confidence. Hurry, this limited-time discount won’t last forever!
We Accept


- What Is Estimation in Statistics?
- Why Is Estimation Crucial for Assignments?
- Key Theoretical Concepts in Estimation Assignments
- 1. Degrees of Freedom (df)
- 2. Unbiasedness and Efficiency
- 3. Standard Error (SE)
- Understanding Confidence Intervals
- A. For a Mean (When Population Standard Deviation Is Unknown)
- B. For Proportions
- C. For Difference Between Two Means
- D. For Correlation Coefficients
- How to Approach an Estimation Assignment Theoretically
- Step 1: Identify the Type of Estimation
- Step 2: Assess Data Characteristics
- Step 3: Define the Estimator
- Step 4: Compute Standard Error and Select Distribution
- Step 5: Formulate and Interpret Confidence Interval
- Step 6: Discuss Reliability
- Common Mistakes in Estimation Assignments and How to Avoid Them
- Sample Theoretical Prompt and Ideal Response (No Computation)
- Final Thoughts
Estimation is a core component of statistical inference, and mastering it is essential for tackling real-world data problems. This blog offers a comprehensive theoretical framework for handling estimation-based statistics assignments, ideal for students who want to understand the "why" behind the formulas rather than just plug in numbers. From point and interval estimation to standard error and confidence intervals, each concept is broken down into clear, digestible sections. Whether you're working with means, proportions, or correlation coefficients, you'll gain a solid foundation in selecting appropriate estimators, applying the t-distribution, and interpreting degrees of freedom.
What makes this guide unique is its emphasis on theoretical clarity without diving into computation-heavy solutions. It’s perfect for students preparing written responses, dealing with take-home exams, or working on conceptual homework questions. If you're stuck trying to figure out when to use Welch’s method or how sample size affects the width of a confidence interval, this blog has you covered.

Need extra support beyond theory? Our statistics homework help services offer expert guidance for assignments involving estimation and more. Stay ahead academically by deepening your understanding and sharpening your analytical skills—starting right here.
What Is Estimation in Statistics?
In statistical inference, estimation refers to the process of approximating population parameters using sample data. This includes estimating population means, proportions, variances, and even correlations. Two types of estimates are central:
- Point Estimation – A single value calculated from the sample to approximate a population parameter (e.g., the sample mean xˉ as an estimate of population mean μ\mu).
- Interval Estimation – A range of values (often a confidence interval) constructed from the sample data that likely contains the true population parameter.
Why Is Estimation Crucial for Assignments?
In most real-world situations, collecting data from an entire population is impractical. Assignments that focus on estimation simulate this challenge and assess your ability to:
- Apply mathematical logic to real data.
- Understand variability and uncertainty.
- Build statistical intervals with given confidence levels.
- Choose the right estimation technique based on data characteristics.
By mastering estimation, students gain a deeper appreciation of sampling variability, statistical accuracy, and decision-making under uncertainty.
Key Theoretical Concepts in Estimation Assignments
1. Degrees of Freedom (df)
Degrees of freedom play a crucial role when estimating parameters like the sample variance or constructing t-distributions. In most estimation problems:
- When estimating the population mean using sample data, df = n−1 (where n is the sample size).
- The more degrees of freedom, the closer the sample distribution approximates the normal distribution.
2. Unbiasedness and Efficiency
A good estimator should:
- Be unbiased: its expected value equals the true parameter.
- Be efficient: among all unbiased estimators, it has the smallest variance.
These properties are often theoretically assessed in assignments where you're asked to compare estimators.
3. Standard Error (SE)
The standard error is a critical quantity in both point and interval estimation. For instance:
- SE=s/n for the sample mean.
This captures how much your estimate might vary from sample to sample.
Understanding Confidence Intervals
Most estimation assignments require constructing confidence intervals, which are ranges where we expect the true population parameter to lie.
A. For a Mean (When Population Standard Deviation Is Unknown)
Use the t-distribution:

Where:
- xˉ is the sample mean.
- s is the sample standard deviation.
- tα/2,df is the critical value from the t-distribution.
- n is the sample size.
Assignments typically provide sample data and ask for 95% or 99% confidence intervals.
B. For Proportions
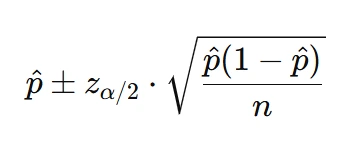
This method is common in surveys and binary outcome data, and students must recognize when normal approximation applies.
C. For Difference Between Two Means
Depending on the sample relationship and variance equality:
- Independent samples: Pooled or unpooled variance methods.
- Paired samples: Use differences and a single sample t-test.
Assignments often describe two groups (e.g., treatment vs control) and request comparative confidence intervals.
D. For Correlation Coefficients
Since the sampling distribution of rr (correlation) is not normally distributed, the Fisher z-transformation is used:
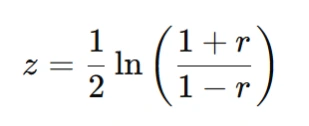
Then, compute CI using normal distribution and convert back using inverse transformation.
This is particularly common in psychology and social science-based assignments.
How to Approach an Estimation Assignment Theoretically
Let’s break down how a student should handle such assignments without relying on specific numerical computations.
Step 1: Identify the Type of Estimation
- Is it about a mean, proportion, difference, or correlation?
- Is the population standard deviation known?
- Is the data paired or independent?
This categorization sets the mathematical path forward.
Step 2: Assess Data Characteristics
- Sample size n
- Whether the population is normally distributed (or if sample size is large enough for the Central Limit Theorem to apply)
- Whether samples are independent or paired
These determine whether you use z or t distributions, and which formulas are valid.
Step 3: Define the Estimator
State the point estimator explicitly:
- xˉ for mean
- p^ for proportion
- s^2 for variance
Assignments may also ask to justify why an estimator is unbiased or efficient.
Step 4: Compute Standard Error and Select Distribution
Theory questions will often expect you to:
- Derive the standard error formula.
- Explain why a t-distribution is more appropriate than a z-distribution (typically due to unknown population standard deviation or small sample size).
Step 5: Formulate and Interpret Confidence Interval
Even without numeric computation, you should demonstrate:
- How to write the confidence interval formula.
- What each component means.
- How to interpret the result (e.g., “We are 95% confident the true mean lies between…”).
Step 6: Discuss Reliability
Assignments might require discussing:
- How sample size affects the width of the interval.
- The impact of confidence level (higher confidence means wider interval).
- Assumptions underlying the CI formula (e.g., independence, normality).
Common Mistakes in Estimation Assignments and How to Avoid Them
| Mistake | Theoretical Insight |
|---|---|
| Confusing t and z distributions | Use z only when population variance is known or n>30n > 30 |
| Forgetting degrees of freedom | Always subtract 1 for one-sample problems |
| Misinterpreting confidence level | It doesn’t mean there's a 95% chance the parameter is in your interval |
| Incorrect formula usage for difference in means | Paired vs independent samples require different approaches |
| Assuming unbiasedness without proof | Explain why xˉ is unbiased using expectation |
Sample Theoretical Prompt and Ideal Response (No Computation)
Q: Describe how you would estimate the difference between two population means from independent samples, where population variances are unequal.
A:
To estimate the difference between two population means from independent samples with unequal variances, I would use the Welch’s t-interval approach. The point estimator is xˉ1−xˉ2. The standard error is:

Since the variances are unequal, I use the Welch–Satterthwaite approximation for degrees of freedom:
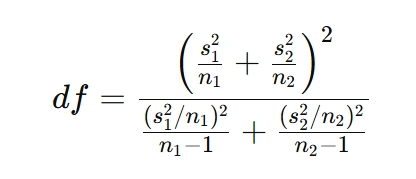
The confidence interval is:
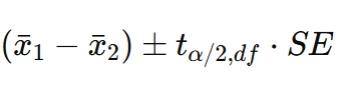
I would also ensure that the samples are independently drawn and assess normality through graphical methods or the Central Limit Theorem if n1n_1 and n2n_2 are large.
Final Thoughts
Assignments based on estimation aren’t just about plugging numbers into formulas—they test a student’s grasp of fundamental statistical reasoning. A strong theoretical approach demonstrates:
- Understanding of sampling distributions.
- Confidence interval logic.
- The limitations of inferential conclusions.
Whether your assignment involves estimating a mean test score, a population proportion, or the difference in income between two cities, the underlying statistical framework is universal. Master this theory, and you’ll be well-prepared for both exams and real-world data problems.