How to Solve Statistical Assignments Using One-Way ANOVA and Kruskal-Wallis Test
.svg)
Claim Your Discount Today
Get 10% off on all Statistics homework at statisticshomeworkhelp.com! Whether it’s Probability, Regression Analysis, or Hypothesis Testing, our experts are ready to help you excel. Don’t miss out—grab this offer today! Our dedicated team ensures accurate solutions and timely delivery, boosting your grades and confidence. Hurry, this limited-time discount won’t last forever!
We Accept


- Understanding One-Way ANOVA
- Steps to Solve an Assignment Using One-Way ANOVA
- Understanding Kruskal-Wallis Test
- Steps to Solve an Assignment Using Kruskal-Wallis Test
- Best Practices in Reporting Statistical Findings
- Conclusion
Statistics assignments often require students to analyze datasets and interpret results using various statistical tests, making the need for expert guidance crucial. Mastering statistical concepts is essential for students tackling assignments involving One-Way ANOVA and the Kruskal-Wallis test. These methods play a crucial role in data analysis, helping researchers compare multiple groups effectively. For students seeking statistics homework help, understanding the theoretical background and application of these tests is vital to achieving accurate results. A well-structured approach ensures that all assumptions are met, appropriate tests are applied, and results are interpreted correctly. By learning these techniques, students can confidently analyze research data and present findings in a meaningful way. When handling complex statistical tasks, it is essential to consider factors such as data distribution, effect size, and hypothesis formulation. Students often require additional guidance to grasp these elements fully, making external academic support valuable. If you need help with ANOVA homework, focusing on practical applications and real-world examples can significantly enhance comprehension. Interpreting statistical results accurately and presenting them in structured reports is a skill that can set students apart in their academic pursuits. With a clear understanding of these statistical methods, students can navigate assignments with ease, ensuring their analyses are both valid and reliable.
Understanding One-Way ANOVA

One-Way ANOVA is a statistical method used to compare the means of three or more independent groups to determine if at least one group differs significantly from the others. This test assumes normality, homogeneity of variance, and independence of observations. Researchers use One-Way ANOVA in scenarios such as analyzing the effectiveness of different medical treatments, comparing student performance across various educational programs, or evaluating customer satisfaction in multiple service categories. The test provides an F-statistic and p-value to assess whether observed differences are statistically significant, helping researchers draw reliable conclusions about population means.
Steps to Solve an Assignment Using One-Way ANOVA
- Define the Research Question
- Identify the dependent variable (continuous) and the independent variable (categorical with three or more groups).
- Example: Comparing plaque index scores across three groups of dialysis patients.
- Formulate Hypotheses
- Null Hypothesis (H₀): There is no significant difference in means across the groups.
- Alternative Hypothesis (H₁): At least one group mean differs significantly.
- Check Assumptions
- Normality: Use Shapiro-Wilk or Kolmogorov-Smirnov test.
- Homogeneity of Variance: Use Levene’s Test.
- Independence: Ensure samples are randomly selected and independent.
- Conduct One-Way ANOVA Test
- Compute the F-statistic using: F = SSbetween / SSwithin
- Determine the p-value and compare it to α (e.g., 0.05).
- Post-Hoc Analysis (If Significant Results Found)
- Use Tukey’s HSD, Bonferroni, or Scheffé test to determine which groups significantly differ.
- Compute Effect Size
- Effect size (η²) measures practical significance: η² = SSbetween / SStotal
- Interpretation:
- Small (0.02)
- Medium (0.06)
- Large (0.14)
- Interpret Results
- Summarize findings with a focus on whether the null hypothesis is rejected.
- Discuss implications in the context of the research question.
Understanding Kruskal-Wallis Test
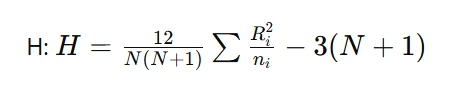
The Kruskal-Wallis test is a non-parametric alternative to One-Way ANOVA used when data do not meet normality assumptions. It compares the median ranks of three or more independent groups to determine if significant differences exist among them. This test is commonly used in scenarios where data are ordinal or non-normally distributed, such as evaluating patient recovery rates across different treatments, assessing customer satisfaction levels, or analyzing survey responses. The Kruskal-Wallis test produces an H-statistic and p-value to determine whether to reject the null hypothesis. If the p-value is below a chosen significance level (e.g., 0.01), at least one group significantly differs from the others. Post-hoc pairwise comparisons help identify specific differences between groups, ensuring a thorough understanding of data distribution patterns. It compares median ranks among groups rather than means.
Steps to Solve an Assignment Using Kruskal-Wallis Test
- Define the Research Question
- Example: Comparing median Vitamin B12 levels among three age groups.
- Formulate Hypotheses
- Null Hypothesis (H₀): The median ranks of all groups are equal.
- Alternative Hypothesis (H₁): At least one group has a different median rank.
- Check Assumptions
- Data should be ordinal or continuous.
- Samples should be independent.
- Conduct Kruskal-Wallis Test
- Compute the test statistic
- Determine the p-value and compare it to α (e.g., 0.01).
- Post-Hoc Analysis (If Significant Results Found)
- Use Dunn’s test to compare specific groups.
- Interpret Results
- Report findings, highlighting whether differences exist between groups.
Best Practices in Reporting Statistical Findings
Effective statistical reporting requires clarity, accuracy, and adherence to standardized formats to ensure that findings are comprehensible and credible. When presenting results from tests such as One-Way ANOVA or the Kruskal-Wallis test, it is important to provide clear tables summarizing means, medians, standard deviations, effect sizes, and confidence intervals. Reports should avoid raw statistical outputs and instead emphasize well-structured tables in APA format. Additionally, interpretations should link findings to the research question, discussing whether the null hypothesis was rejected and what the results imply in a practical context. Using precise language while avoiding overgeneralization or misinterpretation ensures that statistical findings remain valid and reliable. Moreover, including visual aids such as boxplots and bar charts enhances comprehension by providing graphical representations of data trends. Proper documentation of statistical assumptions, test limitations, and post-hoc analysis findings further strengthens the integrity of the report. Ultimately, a structured and systematic approach to statistical reporting ensures that results are both transparent and actionable.
- Use Clear Summary Tables
- Present means, standard deviations, and effect sizes for ANOVA.
- Display median ranks for Kruskal-Wallis test.
- Avoid Direct SPSS Outputs
- Instead, create well-structured tables in APA format.
- Provide Contextual Interpretation
- Explain what statistical results mean in the context of the study.
Conclusion
Understanding and applying statistical techniques such as One-Way ANOVA and the Kruskal-Wallis test is crucial for students and researchers dealing with group comparisons. A systematic approach to solving such assignments ensures that all steps, from hypothesis formulation to assumption checks and result interpretation, are handled correctly. Seeking statistics homework help can provide additional clarity, especially when dealing with complex datasets and nuanced statistical methods. By following best practices in reporting, including using clear summary tables, interpreting results in context, and documenting assumptions and limitations, students can enhance the credibility of their statistical analyses. Whether performing parametric or non-parametric tests, maintaining precision and clarity in every stage of the process ensures meaningful conclusions. Mastering these statistical techniques will not only improve academic performance but also prepare students for real-world data analysis challenges, allowing them to contribute valuable insights in their respective fields.