How to Approach Statistics Assignments in Data Science
.svg)
Claim Your Discount Today
Get 10% off on all Statistics homework at statisticshomeworkhelp.com! Whether it’s Probability, Regression Analysis, or Hypothesis Testing, our experts are ready to help you excel. Don’t miss out—grab this offer today! Our dedicated team ensures accurate solutions and timely delivery, boosting your grades and confidence. Hurry, this limited-time discount won’t last forever!
We Accept


- Understanding the Distribution of a Dataset
- Measuring the Spread of Data
- Descriptive Statistics – The Foundation of Data Analysis
- Probability and Probability Distributions
- Statistical Inference – Drawing Conclusions from Data
- Correlation and Regression Analysis
- Data Analysis for Data Science Assignments
- Connecting Statistics and Data Science
- Common Mistakes to Avoid in Statistics Assignments
- Conclusion
In today’s data-driven world, Statistics for Data Science stands as one of the most essential academic and professional competencies. Whether you’re pursuing a degree in data science, economics, computer science, or business analytics, understanding statistics is fundamental to how data is collected, analyzed, and interpreted. Students often face challenges in assignments that demand applying a mix of statistical concepts such as probability distributions, inferential testing, and correlation analysis. At StatisticsHomeworkHelper.com, our statistics homework help experts simplify these complex tasks by providing clear, step-by-step solutions tailored to academic requirements. We focus on helping students grasp key principles like understanding dataset distributions, measuring data spread, interpreting descriptive statistics, and drawing conclusions using statistical inference. These skills not only strengthen academic performance but also build practical analytical abilities crucial in the data science field. With professional help with data science assignments, students can approach intricate statistical problems with confidence, ensuring accuracy in analysis and presentation. Our goal is to make statistics assignments more manageable and insightful, transforming theoretical knowledge into practical understanding that supports academic excellence and career growth in data-driven disciplines.

Understanding the Distribution of a Dataset
Every data science assignment begins with understanding the nature and distribution of the dataset. Before applying advanced techniques like regression or hypothesis testing, students must identify how data points are spread across variables.
A distribution describes how often each value occurs in a dataset. Common types include:
- Normal Distribution: Symmetrical, bell-shaped curve; mean = median = mode.
- Skewed Distribution: Asymmetrical; data lean to the left (negatively skewed) or right (positively skewed).
- Uniform Distribution: All outcomes have equal probability.
- Bimodal Distribution: Two peaks indicate two dominant groups or behaviors.
How to analyze distribution:
- Plot histograms, box plots, or density plots using tools like Excel, Python, or R.
- Calculate measures such as mean, median, mode, skewness, and kurtosis to understand shape and central tendency.
- Check for outliers, which can distort interpretation.
Example in an assignment:
If you are analyzing the distribution of customer ages for a marketing dataset, check whether the distribution is skewed toward younger or older customers. This insight helps guide segmentation and model selection.
Measuring the Spread of Data
Once you understand the distribution, the next step is to measure how much variation exists within your data. This is often referred to as the measure of spread or dispersion.
Common metrics include:
- Range: Difference between maximum and minimum values.
- Variance: Average squared deviation from the mean.
- Standard Deviation (SD): Square root of variance; shows how much data deviates from the mean.
- Interquartile Range (IQR): Difference between the 75th and 25th percentiles; helps detect outliers.
How to approach this in assignments:
- Compute variance and standard deviation for all key variables.
- Compare variability between different groups or features.
- Use boxplots to visualize spread and detect anomalies.
Why it matters:
In data science assignments, measuring spread helps determine model stability and reliability. For instance, high variance in input variables can influence machine learning models like linear regression or decision trees.
Descriptive Statistics – The Foundation of Data Analysis
Descriptive statistics summarize and describe the basic features of a dataset. Before jumping into inferential or predictive analysis, you must first explore the data descriptively.
Key descriptive measures include:
- Measures of Central Tendency: Mean, Median, Mode
- Measures of Dispersion: Range, Variance, Standard Deviation, IQR
- Shape: Skewness, Kurtosis
- Proportions and Percentiles
Typical assignment tasks:
- Summarize the data using descriptive measures.
- Compare variables (e.g., average income by region).
- Interpret what these summaries mean in context.
Example:
In a Data Science assignment involving housing prices, you might be asked to calculate and interpret the mean and median price, along with the standard deviation. A large standard deviation indicates high variability, meaning prices differ significantly between houses.
Practical tip:
Always combine numerical summaries with visualizations like histograms, boxplots, and bar charts to provide a holistic view of the data.
Probability and Probability Distributions
Understanding probability is fundamental for Statistical Analysis and Data Science. Probability quantifies uncertainty — the likelihood of events occurring. Assignments often require applying probability concepts to analyze risk, uncertainty, or random processes.
Key concepts:
- Probability Rules: Addition, multiplication, and complement rules.
- Conditional Probability: ( P(A|B) P(A∩B)/PB
- Bayes’ Theorem: Helps update probabilities based on new evidence.
Common probability distributions:
- Binomial Distribution: Discrete distribution for counting successes in repeated trials.
- Poisson Distribution: Models the number of events in a fixed interval (e.g., number of emails received per hour).
- Normal Distribution: Continuous distribution central to most inferential tests.
- Exponential Distribution: Models time between events.
Example Assignment Question:
“A website receives an average of 5 customer queries per hour. What is the probability of receiving exactly 7 queries in an hour?”
This problem involves using the Poisson distribution formula:
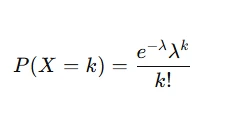
where λ = 5 ) and ( k = 7 ).
Understanding probability distributions helps students simulate real-world data scenarios and build predictive models.
Statistical Inference – Drawing Conclusions from Data
Statistical inference allows you to make conclusions about populations based on sample data. This is crucial in data science when you cannot study an entire population.
Key components:
- Sampling and Sampling Distribution
- Confidence Intervals
- Hypothesis Testing
- p-values and Significance Levels
Steps to solve inference-based assignments:
- Formulate hypotheses:
- Choose the right test:
- Compute test statistics and p-values using Excel, R, or Python.
- Interpret results:
Null hypothesis (( H_0 )): There is no effect or difference.
Alternative hypothesis (( H_1 )): There is an effect or difference.
t-test for comparing means.
z-test for large samples.
ANOVA for comparing more than two groups.
Chi-square for categorical data.
If ( p < 0.05 ), reject ( H_0 ).
Draw data-driven conclusions.
Example:
Suppose your assignment asks you to determine whether there’s a significant difference in average income between two cities. You’d perform an independent samples t-test and interpret whether the difference is statistically significant.
Why this matters in Data Science:
Inferential statistics are used in A/B testing, model validation, and performance evaluation, helping data scientists generalize findings to larger populations.
Correlation and Regression Analysis
Correlation analysis measures the strength and direction of the relationship between two quantitative variables. It’s one of the most common tasks in Statistics for Data Science assignments.
Key measures:
- Pearson Correlation (r): Measures linear relationships (values range from -1 to +1).
- Spearman’s Rank Correlation: For non-linear or ordinal data.
How to interpret correlation results:
- ( r = 1 ): Perfect positive correlation
- ( r = -1 ): Perfect negative correlation
- ( r = 0 ): No correlation
Example:
In a dataset containing study hours and exam scores, a correlation of ( r = 0.85 ) suggests a strong positive relationship — more study hours lead to higher scores.
Regression Analysis:
While correlation shows association, regression explains how one variable affects another.
The simplest form is linear regression:
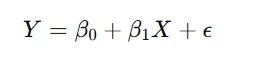
where:
- ( Y ): Dependent variable
- ( X ): Independent variable
- β0,β1: Coefficients
- ϵ: Error term
Assignments may also involve multiple regression, logistic regression, or time-series regression depending on complexity.
Practical use in Data Science:
Regression models form the foundation of predictive analytics — from predicting sales growth to forecasting demand or customer churn.
Data Analysis for Data Science Assignments
Assignments in Data Science often go beyond mathematical calculations — they require interpreting results and drawing actionable insights.
Typical steps for Data Analysis:
- Data Cleaning: Handle missing values, remove duplicates, and correct data types.
- Exploratory Data Analysis (EDA): Use visualizations and descriptive statistics to identify patterns.
- Model Building: Choose appropriate models (regression, classification, clustering).
- Validation: Evaluate model accuracy using metrics like R², MAE, or RMSE.
- Interpretation: Communicate findings with clarity and context.
Common tools for analysis:
- Excel: For descriptive statistics and basic inference tests.
- Python (Pandas, NumPy, SciPy, Scikit-learn): For advanced modeling.
- R: For statistical modeling and visualization.
- Tableau or Power BI: For visualization and storytelling.
Pro Tip:
When working on assignments, always justify your choice of technique and interpret results in plain language. Professors value clarity and reasoning over complex formulas.
Connecting Statistics and Data Science
The link between Statistics and Data Science lies in decision-making. Statistics provides the theoretical foundation, while data science applies it using technology and real-world data.
Key overlaps:
- Probability distributions underpin machine learning algorithms.
- Inferential statistics supports predictive modeling.
- Correlation and regression drive feature selection.
- Descriptive statistics guide initial data exploration.
Example Application:
A data scientist building a churn prediction model starts with descriptive analysis (average customer tenure, spending), checks correlations (e.g., between usage frequency and churn), applies inference tests to validate patterns, and finally builds a logistic regression or classification model.
Understanding these connections helps students not only solve assignments but also think like data scientists.
Common Mistakes to Avoid in Statistics Assignments
Students often lose marks in statistics assignments due to common errors. Avoid these pitfalls:
- Ignoring data visualization — tables alone aren’t enough.
- Misinterpreting correlation as causation.
- Forgetting to check assumptions (normality, homoscedasticity).
- Reporting results without context.
- Not including proper citations or explanations for statistical tests used.
Tip:
Always explain why you used a particular test or metric. Clarity and justification make your analysis stand out.
Conclusion
Solving assignments in Statistics for Data Science requires both analytical thinking and practical application skills. From understanding dataset distributions and measuring spread to conducting statistical inference and correlation analysis, every concept plays a role in building strong data literacy.
When you approach assignments systematically — analyze the data, choose appropriate methods, perform correct calculations, and interpret results meaningfully — you not only score better but also develop real-world data analysis competence.
For students looking to master these skills and handle complex datasets confidently, StatisticsHomeworkHelper.com is your trusted partner in academic success. Our experts are here to guide you through every step, ensuring that statistics becomes not a challenge, but a skill you can proudly master.