Understanding Data Wrangling and Regression Analysis Assignments in Statistics
.webp)
Claim Your Discount Today
Get 10% off on all Statistics homework at statisticshomeworkhelp.com! Whether it’s Probability, Regression Analysis, or Hypothesis Testing, our experts are ready to help you excel. Don’t miss out—grab this offer today! Our dedicated team ensures accurate solutions and timely delivery, boosting your grades and confidence. Hurry, this limited-time discount won’t last forever!
We Accept


- 1. Understanding the Structure of a Data Wrangling Assignment
- 2. Reading and Preparing Raw Data Files
- 3. Logical Filtering and Subsetting
- 4. Computing Descriptive Statistics
- 5. Constructing Confidence Intervals
- 6. Linear Regression with Interaction Terms
- 7. Degrees of Freedom and Error Estimation
- 8. Summarizing Grouped Means with Confidence Intervals
- 9. Visualizing Group Statistics
- 10. Working with Nested or Event-Based Data
- 11. Building Predictive Models from Complex Data
- Conclusion
Solving advanced statistics assignments requires more than just running code—it demands a deep understanding of data wrangling, statistical reasoning, and model interpretation. Whether you're filtering datasets based on specific demographic variables, summarizing numeric trends, or performing complex regressions with interaction terms, each task tests your ability to apply theory to practice. This blog is designed for students who seek detailed guidance on tackling such tasks and want to elevate their approach to assignments that involve structured data analysis, such as those found in upper-level university courses. If you're looking for reliable statistics homework help that walks you through real-world applications—like handling metadata, creating grouped summaries, or computing confidence intervals—then you're in the right place. We'll also explore best practices for linear modeling and interpretation, including how to effectively handle block-treatment designs and estimate coefficients. For students who specifically need help with regression analysis homework, this blog provides a conceptual roadmap, explaining how to construct and interpret models that include both main and interaction effects. From calculating proportions based on logical filters to analyzing event-based sensor data, this guide brings clarity and structure to a type of assignment many students find overwhelming, equipping you with the theoretical tools to succeed.
1. Understanding the Structure of a Data Wrangling Assignment

These assignments often begin by providing raw or semi-structured datasets (e.g., CSVs without headers, RData files with nested objects) and expect the student to:
- Import and format the data appropriately.
- Merge multiple sources using keys or shared variables.
- Filter subsets of data based on logical or categorical criteria.
- Compute summary statistics like means, proportions, or standard deviations.
- Create visualizations that capture central tendencies and variability.
- Fit and interpret linear models, including models with interaction effects.
Let’s explore how each of these components can be addressed in a systematic way.
2. Reading and Preparing Raw Data Files
A common first hurdle in such assignments is the data import process. For instance, files may be provided without column headers or come with separate metadata files explaining the structure. It is essential to:
- Identify the type of each file (e.g., .csv, .RData) and the expected format.
- Use read_csv() or read.table() for CSV files, remembering to set col_names = FALSE if headers are not included.
- Align the imported data with the provided metadata file to manually assign appropriate column names.
- Validate the data types of each variable — categorical, numerical, or binary.
This preparation ensures that downstream operations like filtering and modeling behave as expected. Assignments often test whether students understand the importance of precision in preprocessing.
3. Logical Filtering and Subsetting
Once the dataset is prepared, the next task typically involves extracting specific subsets based on multiple conditions. For example:
- Filtering for certain demographic attributes (e.g., non-US women with advanced degrees).
- Selecting only rows with valid or non-null entries in key columns.
- Applying multiple conditions simultaneously using logical operators (&, |).
The theoretical foundation here is Boolean algebra and conditional selection, which underpins much of data wrangling in R or Python. For instance, to select only female non-US individuals with a doctorate working in state government, one must understand the interplay between factors and their levels, and how to match them correctly in code.
The pedagogical goal is to encourage students to think like investigators — pinpointing specific groups or patterns from larger datasets using precise criteria.
4. Computing Descriptive Statistics
After filtering, the next challenge is summarizing the selected data. Assignments often require the computation of:
- Count: The number of observations that meet certain criteria.
- Mean and Standard Deviation: Measures of central tendency and dispersion for a numerical variable.
- Proportion: The relative frequency of a condition (e.g., having a positive capital gain).
While tools like mean(), sd(), and nrow() do the heavy lifting, students must conceptually understand what each statistic tells us. For example, calculating the proportion of positive outcomes involves creating a logical vector and taking its mean — a statistical principle that connects probability to empirical frequency.
Such computations are foundational to understanding broader concepts like sampling distributions, estimation, and inferential logic.
5. Constructing Confidence Intervals
A common assignment element is constructing confidence intervals (CIs), particularly for means. Students are usually expected to apply the formula:
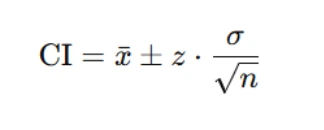
Where:
- xˉ is the sample mean,
- z is the critical value (e.g., 1.96 for 95% confidence),
- σ is the standard deviation (or standard error), and
- n is the number of observations.
In theoretical terms, this involves understanding the sampling distribution of the mean and the Central Limit Theorem (CLT), which justifies the use of normal approximations for large samples. Assignments may test both the mechanics of calculation and the interpretation of the interval — what it means for the population mean and the uncertainty in our estimate.
6. Linear Regression with Interaction Terms
Assignments often require fitting regression models to understand how different factors influence a response variable. This typically involves:
- Fitting a linear model of the form:
- Extracting and interpreting coefficients, including:
- The intercept
- Main effects
- Interaction effects
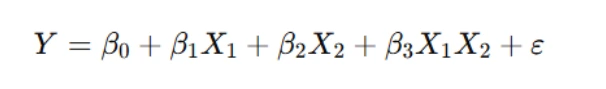
where X1 and X2 are categorical or continuous predictors, and X1X2 denotes an interaction term.
Understanding the inclusion of interaction terms is key: these allow the model to capture how the effect of one variable depends on the level of another. Theoretically, this extends the concept of additive models to more complex dependencies and is critical in factorial experimental designs.
Assignments may also ask students to interpret coefficients relative to reference levels — an important nuance in categorical variable encoding (e.g., treatment contrasts).
7. Degrees of Freedom and Error Estimation
Students may be asked to report model diagnostics, such as:
- The error standard deviation (also known as residual standard error)
- Degrees of freedom associated with the model
This section requires an understanding of statistical estimation, particularly how residual variance is estimated and how degrees of freedom are consumed in the estimation of model parameters. It reinforces core ideas from analysis of variance (ANOVA) and regression theory.
8. Summarizing Grouped Means with Confidence Intervals
Another common task is calculating means and CIs for grouped data. This requires:
- Grouping by multiple factors (e.g., treatment and block)
- Calculating group-wise means, counts, and standard errors
- Constructing CIs for each group
These calculations reinforce the concept of stratification — breaking the data into meaningful segments — and help students understand how precision varies with sample size. The theoretical underpinning here is again the CLT and the properties of the sample mean.
9. Visualizing Group Statistics
Assignments may ask for pointrange plots or faceted visualizations to display group means and confidence intervals. While visualization itself is not heavily theoretical, interpreting these plots is. Students must understand:
- What the points and error bars represent (mean and CI)
- How interaction effects manifest visually (e.g., non-parallel lines across facets)
- The purpose of facets in separating comparisons across groups
Visual literacy in statistics is as important as computational fluency and is often overlooked in early coursework.
10. Working with Nested or Event-Based Data
In more advanced assignments, students may encounter event-based data such as sensor logs or experimental measurements. Tasks might involve:
- Counting unique units (e.g., how many sensors observed an event)
- Aggregating measurements per unit or per event
- Calculating spatial statistics (e.g., average x, y, z coordinates)
This domain challenges students to work with nested structures — for example, a data frame where one row represents an event and contains multiple observations per sensor. The theoretical lens here is multilevel modeling and observational design — understanding that data are not always flat and that relationships occur across levels (sensor → event → time).
11. Building Predictive Models from Complex Data
Finally, students might be asked to fit a predictive model using sensor measurements to estimate a target quantity (like azimuth angle). Even if the model is simple (e.g., a linear regression using x, y, z), the assignment encourages thinking about:
- Variable selection and dimensionality
- The assumptions of linearity and homoscedasticity
- How physical context (e.g., spatial orientation) can be translated into features
This requires students to think beyond the math and consider the scientific logic of modeling: what does it mean to predict an angle from coordinates? How do we validate that the model makes sense?
Conclusion
Assignments like these are not just about running code — they are about cultivating a rigorous, structured approach to statistical analysis. Students must demonstrate fluency across several dimensions:
- Technical skills: loading, filtering, summarizing, modeling
- Statistical reasoning: understanding what statistics and models tell us
- Interpretation: explaining results in plain, meaningful language
- Communication: producing clear outputs, tables, and visualizations
By grounding each component in statistical theory and structured methodology, students can confidently tackle assignments that mirror real-world data challenges.