How to Solve Statistics Assignments Involving Distribution-Free Tests
.webp)
Claim Your Discount Today
Get 10% off on all Statistics homework at statisticshomeworkhelp.com! Whether it’s Probability, Regression Analysis, or Hypothesis Testing, our experts are ready to help you excel. Don’t miss out—grab this offer today! Our dedicated team ensures accurate solutions and timely delivery, boosting your grades and confidence. Hurry, this limited-time discount won’t last forever!
We Accept


- Understanding the Purpose of Distribution-Free Tests
- Common Types of Distribution-Free Tests in Assignments
- Solving Assignments on Distribution-Free Tests: Step-by-Step Guide
- Step 1: Identify the Nature of the Data
- Step 2: Select the Appropriate Distribution-Free Test
- Step 3: Rank or Resample as Required
- Step 4: Compute the Test Statistic
- Step 5: Determine the p-value
- Step 6: Interpret the Result
- Additional Tips for Excelling in Distribution-Free Test Assignments
- Conclusion: Think Like a Statistician
When students face statistics assignments involving distribution-free tests (also known as nonparametric tests), they often find themselves uncertain about the proper methods, assumptions, and interpretations. Unlike parametric tests, which require specific distributional conditions (usually normality), distribution-free tests are versatile tools that can be applied to a wider variety of data scenarios, especially when sample sizes are small or data violate normality assumptions.
This blog offers a detailed and focused guide on how to approach, understand, and solve statistics assignments centered on distribution-free tests. It draws closely from common educational materials such as those in “Online Statistics Education” by David Lane et al., particularly the chapter on Distribution-Free Tests, but generalizes its principles to help students tackle a range of similar assignments. Whether you're stuck on choosing the right nonparametric test or struggling with rank-based procedures, this post provides the statistics homework help you need to complete such tasks with confidence.
Understanding the Purpose of Distribution-Free Tests

Distribution-free tests help analyze data without assuming a specific distribution, making them ideal for non-normal, ordinal, or small-sample datasets. These tests are especially useful when standard parametric assumptions cannot be met, offering reliable alternatives for hypothesis testing and data interpretation in varied academic and real-world statistical scenarios.
The main purpose of distribution-free tests is to provide valid inferential results without assuming a specific distribution for the population. These tests are essential when:
- Data are ordinal or ranked rather than interval or ratio.
- The sample size is too small to reliably estimate parameters like the mean and standard deviation.
- The assumption of normality is violated.
- Outliers are present and robust methods are needed.
Assignments in this domain often involve choosing the appropriate test, performing rank-based or randomization calculations, and interpreting the results correctly.
Common Types of Distribution-Free Tests in Assignments
Assignments may include Mann-Whitney U, Wilcoxon signed-rank, Kruskal-Wallis, Spearman’s rank correlation, and Fisher’s exact test. Each test suits specific data structures like ranks, paired observations, or contingency tables. Understanding which test to apply depends on the number of groups, sample independence, measurement scale, and whether testing differences or associations.
Most assignments will focus on one or more of the following test types:
- Randomization Tests
- Two Conditions (e.g., testing difference in means with random reassignment of group labels)
- Two or More Conditions (e.g., analyzing variance through permutations)
- Association Tests (e.g., randomization of variables to test for correlation significance)
- Rank-Based Tests
- Mann-Whitney U Test (a substitute for the independent t-test)
- Wilcoxon Rank Sum or Signed-Rank Test (used for paired data)
- Kruskal-Wallis Test (an alternative to one-way ANOVA)
- Spearman’s Rank Correlation (nonparametric alternative to Pearson’s r)
- Exact Tests
- Fisher's Exact Test for small sample contingency tables
Solving Assignments on Distribution-Free Tests: Step-by-Step Guide
Start by identifying the data type and structure. Choose the suitable test based on conditions. Rank or resample data as required. Compute test statistics and derive p-values. Finally, interpret results based on context and significance level. This logical, sequential approach ensures accuracy and clarity in distribution-free test assignments.
Let’s break down the process of solving a statistics assignment on distribution-free tests into coherent, actionable steps.
Step 1: Identify the Nature of the Data
Understanding the level and structure of the data is foundational. Ask:
- Is the data nominal, ordinal, interval, or ratio?
- Are the samples independent or paired?
- Is the number of conditions 2 or more?
- Are we testing association or group differences?
This classification helps in choosing the correct test.
Example Assignment Cue: “Compare median satisfaction scores between two brands.”
Approach: Use Mann-Whitney U Test since the variable is likely ordinal and the samples are independent.
Step 2: Select the Appropriate Distribution-Free Test
Based on data classification:
- Two independent groups, ordinal or non-normal data → Mann-Whitney U
- Paired samples or repeated measures → Wilcoxon Signed-Rank Test
- More than two groups → Kruskal-Wallis H
- Rank correlation between two variables → Spearman’s ρ
- Contingency tables with small expected frequencies → Fisher’s Exact Test
- Non-standard group labels with observed difference → Randomization test (especially in custom-designed experiments)
Pro Tip: Many assignments provide data that suggest but do not explicitly state test requirements. Make test choice part of your answer justification.
Step 3: Rank or Resample as Required
Most distribution-free tests rely on either ranking or permutations.
- Ranking: Convert data into ranks. If there are ties, assign average ranks. Calculate rank sums or test statistics accordingly.
- Randomization: Reshuffle group labels or outcomes many times (usually via software or spreadsheet) to simulate the null distribution.
Example Assignment Step: “Shuffle treatment labels and compute the difference in means. Repeat five times.”
Solution Strategy: Generate several permutations and track the difference in means. Then assess where the observed difference lies in this distribution.
Step 4: Compute the Test Statistic
Once ranks are assigned or permutations are generated, compute the relevant test statistic:
- Mann-Whitney U: Use rank sums to calculate U for each group.
- Wilcoxon Signed-Rank: Rank absolute differences of paired data, then sum ranks for positive and negative differences.
- Kruskal-Wallis: Use rank sums and group sizes to compute the H statistic.
- Spearman’s ρ: Calculate Pearson’s correlation on ranks.
- Randomization: Count how many simulated values are as extreme or more extreme than the observed statistic.
Assignments may include pre-ranked data or require you to show intermediate calculations—this is especially common in exam-like formats.
Step 5: Determine the p-value
This step involves comparing your test statistic to either:
- A critical value (from a distribution table), or
- A simulated null distribution (for randomization-based assignments)
For rank-based tests, use exact or approximated critical values depending on sample size.
For randomization tests, p-values are calculated as:
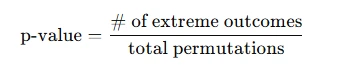
Common assignment challenge: “What’s the two-tailed p-value after 10 randomizations and 2 more-extreme outcomes?”
Answer: 2/10 = 0.2 (note: sometimes 1 is added to numerator and denominator for small samples)
Step 6: Interpret the Result
Your conclusion should:
- Relate the p-value to a chosen alpha level (commonly 0.05)
- Make a clear statement about rejecting or failing to reject the null hypothesis
- Interpret the result in the context of the assignment's subject matter
Example Conclusion: “Since the p-value (0.02) is less than 0.05, we reject the null hypothesis and conclude there is a significant difference in perceived effectiveness between the two teaching methods.”
Additional Tips for Excelling in Distribution-Free Test Assignments
Check assumptions, justify test choices, and show intermediate steps. Use software for calculations but understand manual logic. Avoid overinterpreting results. Always interpret in context. When unsure, prefer nonparametric methods for robustness. Following these practices ensures academic accuracy and strengthens conceptual clarity in distribution-free statistical assignment submissions.
- Know When to Use Distribution-Free Alternatives
- Sample sizes are below 30
- Shapiro-Wilk or Kolmogorov-Smirnov normality tests fail
- The data are ordinal or involve medians
- Cite Assumptions or Lack Thereof
- Use Software But Understand the Logic
- Avoid Overgeneralization
- Nonparametric tests are less powerful than their parametric counterparts.
- Significance does not imply causation without proper experimental design.
Students often wrongly default to t-tests or ANOVA without verifying assumptions. Distribution-free tests are necessary when:
Assignments may ask “Why did you choose a nonparametric method?”
A good answer: “The data were ordinal, and the normality assumption was not tenable based on visual inspection and the Shapiro-Wilk test (p = 0.01). Hence, a distribution-free test was appropriate.”
While tools like SPSS, R, or Excel can compute statistics, many assignments demand manual understanding. Show ranks, describe permutations, and explain what the p-value means.
A common mistake is to interpret a significant result as proof of a strong effect. Remind yourself and your readers that:
Conclusion: Think Like a Statistician
Distribution-free test assignments are not merely computational exercises. They are conceptual challenges requiring clear thinking about data types, assumptions, and appropriate test strategies. Students should approach these tasks not just as number crunchers but as data detectives—interpreting context, selecting the best tools, and explaining conclusions in lay terms.
By mastering these steps—data identification, test selection, ranking or simulating, computing test statistics, interpreting p-values, and communicating results—students can confidently tackle any assignment involving distribution-free tests.
And perhaps more importantly, they build statistical literacy that extends far beyond the classroom.