How to Solve Mathematical Foundation Assignments for Data Science and Analytics
.svg)
Claim Your Discount Today
Get 10% off on all Statistics homework at statisticshomeworkhelp.com! Whether it’s Probability, Regression Analysis, or Hypothesis Testing, our experts are ready to help you excel. Don’t miss out—grab this offer today! Our dedicated team ensures accurate solutions and timely delivery, boosting your grades and confidence. Hurry, this limited-time discount won’t last forever!
We Accept


- Understanding the Assignment Requirements
- Break the assignment into components
- Identify expected outputs
- Solving Vector and Matrix Arithmetic Using NumPy
- Essential NumPy operations
- Expected Values and Normal Distribution Calculations
- Expected value formula
- Normal distribution applications
- Applying Derivatives and Integrals for Optimization
- Derivatives for optimization
- Integrals in modeling
- Probability Theory and Statistical Modeling with Python
- Common probability coding tasks
- Regression using Python
- Data Analysis Using Pandas and Matplotlib
- Essential operations
- Visualization with Matplotlib
- Predictive Modeling and Applied Mathematical Thinking
- Key modeling skills assessed
- Conclusion
In the world of modern analytics and machine learning, every model, algorithm, and data-driven insight is built upon strong mathematical foundations, making subjects like statistics, probability, calculus, linear algebra, and NumPy-based computation essential for academic success. Students pursuing data science frequently face assignments that combine these concepts into complex tasks requiring logical reasoning, structured calculations, and programmatic data analysis. These exercises are not merely academic—they mirror the skills demanded in real analytics and machine learning roles across industries. Assignments from Mathematical Foundations for Data Science and Analytics often require students to compute vector operations, solve optimization problems, apply probability distributions, build predictive models, and interpret statistical outcomes, all within Python’s scientific ecosystem. At statisticshomeworkhelper.com, our experts provide statistics homework help to students who find these topics challenging, offering step-by-step guidance, conceptual clarity, and Python coding support. We assist with matrix algebra, regression, probability theory, data visualization, and modeling so students can confidently apply mathematical concepts to real-world datasets. Whether you’re struggling with NumPy operations, probability calculations, or Python-based statistical analysis, our reliable assistance ensures timely and accurate help with data science assignment tasks, enabling you to build strong analytical skills and excel in your coursework.

This comprehensive guide walks you through how to approach and solve assignments that involve:
- Vector and matrix operations using NumPy
- Expected value calculations and normal distribution applications
- Derivatives, integrals, and optimization tasks
- Probability theory, regression, and predictive analytics using Python
- Data analysis using Pandas, Matplotlib, and computational modeling
- Logical reasoning and applied mathematical thinking
Whether your task focuses on linear algebra, probability distribution analysis, Python modeling, prediction, or statistical visualization, the strategies below will help you structure your approach effectively.
Understanding the Assignment Requirements
Assignments in mathematical foundations are often integrated across topics. For example, an exercise may begin with matrix manipulation, transition into probability modeling, and conclude with a regression model built using Python.
Before writing formulas or running code:
Break the assignment into components
Most problems involve at least one of the following areas:
- Linear algebra: vectors, matrices, dot products, eigenvalues, transformations
- Probability & statistics: expected values, distributions, variance, inference
- Calculus: derivatives for optimization, integrals for accumulated change
- Statistical modeling: regression, prediction, error estimation
- Programming: using Python packages like NumPy, Pandas, and Matplotlib
Categorizing the work reduces cognitive overload and helps you plan the solution step-by-step.
Identify expected outputs
Assignments often ask you to:
- Provide numerical answers
- Show formulas
- Generate plots
- Write Python code
- Interpret model results
Always read rubrics carefully, as interpretation often carries a large portion of marks.
Solving Vector and Matrix Arithmetic Using NumPy
Linear algebra forms the backbone of machine learning and statistical modeling. Assignments commonly require operations such as:
- Matrix addition or multiplication
- Vector dot or cross products
- Transposes and inverses
- Linear transformations
- Systems of linear equations
Python simplifies these computations through NumPy, the most fundamental numerical package in data science.
Essential NumPy operations
import numpy as np
	A = np.array([[1, 2], [3, 4]])
	B = np.array([[5, 6], [7, 8]])
	# Matrix addition
	C = A + B
	# Matrix multiplication
	D = A @ B  # or np.dot(A, B)
	# Vector dot product
	v1 = np.array([1, 2, 3])
	v2 = np.array([4, 5, 6])
	dot = np.dot(v1, v2)
	# Matrix inverse
	inv_A = np.linalg.inv(A)
When writing your assignment, always pair your results with brief explanations:
- What does a dot product represent?
- Why is matrix multiplication not commutative?
- How do transformations relate to PCA or regression?
Linking concepts enhances the academic value of the solution.
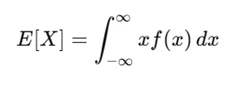
Expected Values and Normal Distribution Calculations
Expected value represents the long-run average outcome of a random variable and appears in assignments involving:
- Risk analysis
- Statistical estimation
- Probability modeling
- Machine learning loss functions
Expected value formula
For discrete variables:

For continuous variables:
Normal distribution applications
Assignments frequently require calculating:
- Z-scores
- Probabilities under the curve
- Cutoff values
- Confidence regions
Python simplifies this through SciPy or NumPy:
from scipy.stats import norm
	# Probability P(X < 1.5) for N(0,1)
	p = norm.cdf(1.5)
	# Z-score for value 10 mean=8 sd=2
	z = (10 - 8) / 2
	# Inverse CDF
	critical = norm.ppf(0.95)
Always include interpretations:
- What does the probability represent?
- How does normality affect model performance?
- When is normal distribution inappropriate?
Applying Derivatives and Integrals for Optimization
Calculus is a central part of assignments involving:
- Optimization
- Machine learning cost functions
- Rate of change
- Area under curves
Derivatives for optimization
Students often compute:
- First derivative to find critical points
- Second derivative to check maxima/minima
- Gradient for multivariate optimization
Example (cost function derivative):
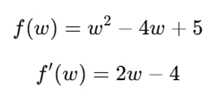
Set (f'(w)=0) → (w=2), the minimum.
Integrals in modeling
Assignments may involve:
- Probability integrals
- Accumulated density
- Total change in a function
- Expected value of continuous variables
Python allows symbolic computation using SymPy:
import sympy as sp
	x = sp.symbols('x')
	f = x**2 + 3*x
	integral = sp.integrate(f, (x, 0, 2))
	derivative = sp.diff(f, x)
Tie results to applications:
- Optimizing a regression model
- Minimizing error functions
- Computing continuous expectation
Probability Theory and Statistical Modeling with Python
Assignments test your reasoning in:
- Conditional probability
- Bayes’ theorem
- Joint and marginal probabilities
- Random variables
- Sampling distributions
- Regression methodology
Common probability coding tasks
import numpy as np
	# Simulating probability outcomes
	samples = np.random.binomial(n=10, p=0.4, size=1000)
	mean_estimate = np.mean(samples)
Regression using Python
Most assignments involve:
- Linear regression
- Prediction
- Residual analysis
- Model accuracy metrics
Using scikit-learn:
from sklearn.linear_model import LinearRegression
	X = np.array([[1], [2], [3], [4]])
	y = np.array([2, 4, 6, 8])
	model = LinearRegression()
	model.fit(X, y)
	pred = model.predict([[5]])
Students must interpret:
- Coefficients
- R² value
- Prediction error
- Model assumptions
Interpretation is often more important than code in academic grading.
Data Analysis Using Pandas and Matplotlib
Assignments usually integrate programming with statistical logic. Pandas simplifies:
- Importing datasets
- Cleaning data
- Handling missing values
- Filtering rows
- Creating summary statistics
- Grouping and aggregating
Essential operations
import pandas as pd
	df = pd.read_csv('data.csv')
	# Summary statistics
	summary = df.describe()
	# Filtering
	filtered = df[df['age'] > 30]
	# Grouping
	average_salary = df.groupby('department')['salary'].mean()
Visualization with Matplotlib
import matplotlib.pyplot as plt
	plt.hist(df['score'])
	plt.xlabel('Score')
	plt.ylabel('Frequency')
	plt.title('Score Distribution')
	plt.show()
Plots are crucial when assignments require:
- Histogram analysis
- Scatterplots for regression
- Line charts for trends
- Boxplots for variability
Predictive Modeling and Applied Mathematical Thinking
As courses progress, assignments integrate multiple mathematical foundations into predictive analytics.
You may be asked to:
- Build a model
- Evaluate performance
- Refine variables
- Compare outcomes
- Validate assumptions
Key modeling skills assessed
- Logical reasoning
- Statistical interpretation
- Appropriate use of packages
- Understanding of probability distribution
- Ability to connect mathematics with real-world outcomes
Assignments may include:
- Predictive modeling of sales
- Probability-based risk scoring
- Matrix factorization for recommendations
- Optimization of cost functions
- Simulation of stochastic processes
The key to scoring well is not only correct computation but also clear explanations.
Conclusion
Assignments on the Mathematical Foundations for Data Science and Analytics Specialization require a balanced mix of mathematical reasoning, statistical logic, code implementation, and interpretation. Whether you are working with NumPy for matrix computations, calculating expected values, solving derivatives, applying probability rules, or building predictive models in Python, systematic thinking is essential.
At StatisticsHomeworkHelper.com, we guide students through these foundations by providing structured steps, computational support, and interpretation assistance. With strong skills in Pandas, NumPy, Probability & Statistics, Applied Mathematics, Data Analysis, Predictive Analytics, and Mathematical Modeling, our experts help you approach each assignment with confidence and accuracy.
This guide serves as a roadmap to handle these subjects efficiently, develop clarity in your solutions, and excel in courses that integrate math with real-world analytics.