How to Solve Assignments on Statistics and Calculus Methods for Data Analysis
.webp)
Claim Your Discount Today
Get 10% off on all Statistics homework at statisticshomeworkhelp.com! Whether it’s Probability, Regression Analysis, or Hypothesis Testing, our experts are ready to help you excel. Don’t miss out—grab this offer today! Our dedicated team ensures accurate solutions and timely delivery, boosting your grades and confidence. Hurry, this limited-time discount won’t last forever!
We Accept


- Understanding the Role of Statistics and Calculus in Data Analysis
- Calculating Expected Values and Applying Normal Distribution
- Theoretical Foundation
- Normal Distribution Applications
- Performing Derivative Calculations for Optimization
- Conceptual Understanding
- Example in Python (Symbolic Differentiation)
- Applications in Data Analysis
- Solving Complex Integrals Using Python for Continuous Data
- Theoretical Background
- Python Implementation (Numerical Integration)
- Application Areas
- Applying Statistical and Calculus Methods in Python for Predictive Modeling
- How the Two Fields Connect
- Machine Learning Connection
- Core Skills You’ll Develop
- Practical Steps to Approach Your Assignment
- Step 1: Understand the Problem
- Step 2: Gather Data
- Step 3: Choose the Right Mathematical Technique
- Step 4: Implement in Python
- Step 5: Interpret Results
- Step 6: Document Your Work
- Why These Topics Are Crucial for Data Science Students
- Conclusion
In today’s data-driven academic world, mastering both statistics and calculus has become a crucial requirement for students pursuing degrees in data science, applied mathematics, machine learning, or analytics. These subjects form the foundation of modern data interpretation and predictive modeling. However, assignments that combine these two disciplines often pose significant challenges, as they require a deep understanding of mathematical theory along with practical computational skills. Tasks such as calculating expected values, performing optimization through derivatives, or solving integrals using Python demand precision, logical reasoning, and analytical thinking. This is where expert statistics homework help can make a real difference. At StatisticsHomeworkHelper.com, our specialists assist students in bridging the gap between theoretical understanding and practical application. By providing structured guidance and detailed explanations, we ensure that every learner grasps both the conceptual and computational aspects of their coursework. Our team also offers step-by-step help with data analysis assignment tasks, empowering students to apply calculus and statistical techniques effectively for real-world insights. This blog aims to serve as a complete guide for students who want to enhance their analytical capabilities and confidently tackle assignments involving Statistics and Calculus Methods for Data Analysis.
Understanding the Role of Statistics and Calculus in Data Analysis

Statistics provides the tools to summarize, interpret, and make inferences from data, while calculus provides the framework to analyze change, optimize models, and derive continuous relationships among variables. Together, they form the foundation of modern data science and predictive modeling.
- Statistics helps in identifying patterns, estimating probabilities, and testing hypotheses.
- Calculus enables us to optimize models by finding minima, maxima, and rates of change, which are critical in machine learning and algorithm development.
When combined, these methods allow analysts to:
- Model complex systems with continuous data.
- Optimize functions used in regression and classification algorithms.
- Evaluate probability distributions and expected outcomes.
- Integrate over continuous spaces to compute total probabilities or cumulative metrics.
Thus, assignments involving both these disciplines prepare you to perform advanced data analysis, statistical modeling, and machine learning tasks effectively.
Calculating Expected Values and Applying Normal Distribution
The expected value (EV) is one of the fundamental concepts in probability and statistics. It represents the long-term average of random outcomes weighted by their probabilities.
Theoretical Foundation
For a discrete random variable ( X ):

For a continuous random variable:
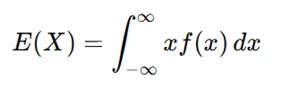
Assignments often require calculating expected values to determine the mean of a distribution or to estimate outcomes in risk analysis, finance, or machine learning loss functions.
Example in Python
import numpy as np
	from scipy.stats import norm
	# Define mean and standard deviation
	mu, sigma = 10, 2
	# Expected value for normal distribution
	expected_value = norm.mean(mu, sigma)
	print("Expected Value:", expected_value)
Normal Distribution Applications
The normal distribution is widely used to model continuous data that cluster around a mean. It’s applied in:
- Hypothesis testing (z-scores, confidence intervals)
- Data normalization
- Predictive modeling (error terms and residuals)
- Feature scaling in machine learning
In assignments, you might be asked to compute probabilities under the curve, such as:
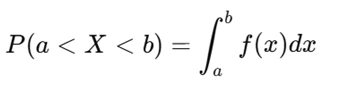
This can be implemented in Python using SciPy:
# Probability that X lies between 8 and 12
	prob = norm.cdf(12, mu, sigma) - norm.cdf(8, mu, sigma)
	print("P(8 < X < 12) =", prob)
Performing Derivative Calculations for Optimization
Derivatives lie at the heart of optimization — a key task in both calculus and machine learning. They measure the rate of change of a function with respect to its inputs and help identify points of maximum or minimum (local extrema).
Conceptual Understanding
Given a function ( f(x) ), its derivative ( f'(x) ) tells us how the output changes as ( x ) changes.
Optimization problems typically involve setting:
f'(x) = 0
to find the critical points and then determining whether they are minima or maxima.
Example in Python (Symbolic Differentiation)
import sympy as sp
	x = sp.Symbol('x')
	f = x**3 - 6*x**2 + 9*x + 15
	df = sp.diff(f, x)
	critical_points = sp.solve(df, x)
	print("Derivative:", df)
	print("Critical Points:", critical_points)
Applications in Data Analysis
- Cost function minimization in regression or neural networks.
- Sensitivity analysis of economic or physical systems.
- Gradient descent algorithms in predictive modeling.
In machine learning, derivatives are essential for adjusting model parameters to minimize prediction errors, forming the backbone of algorithms like linear regression, logistic regression, and deep learning.
Solving Complex Integrals Using Python for Continuous Data
Integrals are used to calculate areas under curves, cumulative probabilities, and total values over continuous domains. In statistics, integrals appear frequently when working with continuous probability density functions (PDFs) or when computing expected values and moments.
Theoretical Background
The definite integral is expressed as:
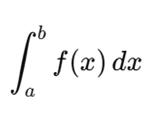
It can represent total probability (area = 1), mean values, or even the total accumulated change over time.
Python Implementation (Numerical Integration)
from scipy.integrate import quad
	# Define function
	def f(x):
	return x**2 * np.exp(-x)
	# Integrate from 0 to infinity
	result, error = quad(f, 0, np.inf)
	print("Integral Result:", result)
Application Areas
- Continuous probability models: Computing total probabilities or tail probabilities.
- Signal processing: Calculating energy over continuous signals.
- Predictive analytics: Estimating cumulative returns or growth.
Integrals are also useful in machine learning for calculating areas under ROC curves and in mathematical modeling for solving differential equations that describe real-world systems.
Applying Statistical and Calculus Methods in Python for Predictive Modeling
Assignments often ask students to merge calculus and statistics concepts to perform predictive modeling — estimating future outcomes based on observed data.
How the Two Fields Connect
- Statistics provides the estimation framework (likelihood, inference, probability models).
- Calculus provides the optimization tools (minimizing loss, maximizing likelihood).
For example, in linear regression, you minimize the sum of squared errors — a calculus-based optimization problem.
Python Example: Linear Regression from Scratch
import numpy as np
	# Simulated data
	X = np.array([1, 2, 3, 4, 5])
	y = np.array([2.2, 2.8, 4.5, 3.7, 5.5])
	# Analytical solution using calculus (Normal Equation)
	X_b = np.c_[np.ones((len(X), 1)), X]
	theta_best = np.linalg.inv(X_b.T.dot(X_b)).dot(X_b.T).dot(y)
	print("Coefficients:", theta_best)
Here, calculus underlies the derivation of the normal equation:

which minimizes the squared error — a purely calculus-driven result applied to a statistical model.
Machine Learning Connection
In advanced assignments, you may encounter:
- Gradient Descent Optimization: Uses derivatives to iteratively minimize a loss function.
- Maximum Likelihood Estimation (MLE): Uses calculus for parameter estimation.
- Probability Density Estimation: Integrates over continuous spaces.
Core Skills You’ll Develop
Assignments combining statistics and calculus strengthen your understanding in the following key areas:
| Skill | Application |
|---|---|
| Probability Distribution | Modeling random variables and data uncertainty |
| Machine Learning | Using derivatives in training algorithms |
| Applied Mathematics | Bridging theory and application in data science |
| Derivatives | Optimization and rate of change |
| Integral Calculus | Continuous data and cumulative analysis |
| Predictive Modeling | Forecasting trends from data |
| Mathematical Modeling | Representing real-world processes with equations |
| Statistical Analysis | Drawing inferences from data |
| Algorithms | Designing data-driven computation methods |
| Data Science | Integrating all of the above for insights |
These competencies collectively enhance your analytical thinking and make you proficient in quantitative problem-solving for research, finance, engineering, and artificial intelligence domains.
Practical Steps to Approach Your Assignment
When you receive an assignment on Statistics and Calculus Methods for Data Analysis, here’s a systematic approach you can follow:
Step 1: Understand the Problem
Carefully read the problem statement. Identify whether it involves statistical modeling (like expected value, variance, or regression) or calculus-based operations (like differentiation or integration).
Step 2: Gather Data
Load the dataset using tools such as pandas or NumPy. Check whether your data is discrete or continuous; this will guide whether to use summations or integrals.
Step 3: Choose the Right Mathematical Technique
- Use probability distributions for stochastic models.
- Apply derivatives for optimization or sensitivity analysis.
- Use integrals for continuous cumulative calculations.
Step 4: Implement in Python
Utilize libraries such as:
- NumPy and Pandas for data handling.
- SymPy for symbolic differentiation/integration.
- SciPy for numerical integration and probability calculations.
- Matplotlib or Seaborn for visualization.
Step 5: Interpret Results
Statistical and calculus outputs are only meaningful when interpreted correctly. Discuss how your findings relate to the data’s context — for example, how optimization improves prediction accuracy or how a probability distribution models uncertainty.
Step 6: Document Your Work
Always explain your steps, formulas, and Python code snippets. A well-documented assignment demonstrates both understanding and clarity.
Why These Topics Are Crucial for Data Science Students
Both calculus and statistics are integral to data science algorithms and predictive analytics. Without them, it’s impossible to:
- Understand how models learn from data.
- Optimize model performance.
- Quantify uncertainty and confidence in predictions.
- Build mathematical models that simulate real-world systems.
By mastering these techniques, students develop a holistic view of how data behaves, how it can be modeled, and how mathematics transforms raw information into actionable insights.
Conclusion
Assignments that combine statistics and calculus are not just mathematical exercises — they are gateways to understanding how analytical systems operate in the real world. By learning how to compute expected values, apply the normal distribution, perform derivatives for optimization, and solve integrals using Python, students develop the intellectual toolkit required for advanced data science and predictive modeling.
If you ever find yourself struggling to connect the dots between statistical theory and calculus applications, remember that help is always available. At StatisticsHomeworkHelper.com, we specialize in turning complex analytical problems into understandable, well-structured solutions that boost both your grades and confidence.
Mastering the fusion of statistics and calculus will not only help you ace your assignments but also prepare you for the mathematical challenges of modern data science — where every equation tells a story hidden within data.