How to Solve Assignments on Portfolio Diversification Using Correlation Matrix

Claim Your Discount Today
Get 10% off on all Statistics homework at statisticshomeworkhelp.com! Whether it’s Probability, Regression Analysis, or Hypothesis Testing, our experts are ready to help you excel. Don’t miss out—grab this offer today! Our dedicated team ensures accurate solutions and timely delivery, boosting your grades and confidence. Hurry, this limited-time discount won’t last forever!
We Accept


- Understanding the Concept of Portfolio Diversification
- The Role of Correlation in Portfolio Diversification
- Why Correlation Matrix is Used
- Steps to Create a Correlation Matrix
- Step 1: Collect Asset Return Data
- Step 2: Calculate Individual Returns
- Step 3: Compute Pairwise Correlations
- Step 4: Construct the Correlation Matrix
- Interpreting the Correlation Matrix
- Applying Correlation Analysis to Portfolio Optimization
- Step 1: Portfolio Variance Formula
- Step 2: Efficient Frontier
- Using Financial Modeling Tools
- Excel
- R
- Python
- Integrating Correlation Analysis with Broader Financial Concepts
- Example Interpretation in a Report
- Practical Application: Real-World Portfolio Example
- Conclusion
In the dynamic world of finance and investment, portfolio diversification is essential for balancing risk and return. Students pursuing finance, economics, or data analytics frequently receive assignments that involve evaluating how different assets within a portfolio interact, and one of the most effective tools for this analysis is the correlation matrix. This powerful statistical method enables students to understand the degree to which assets move together, which is crucial for effective risk management and investment analysis. Assignments on Portfolio Diversification using Correlation Matrix demand a solid grasp of statistics, financial management, and financial modeling, along with the ability to analyze complex data accurately. At statisticshomeworkhelper.com, our statistics homework help experts guide students through every stage of this process — from understanding the theoretical foundations of correlation to building and interpreting correlation matrices using tools like Excel, R, or Python. We focus on helping students develop both conceptual understanding and analytical proficiency, ensuring they can confidently apply these skills to real-world investment problems. Through personalized tutoring and step-by-step guidance, we make solving such finance and statistics assignments simpler, more structured, and academically rewarding.
Understanding the Concept of Portfolio Diversification

Portfolio diversification is a risk management strategy used to reduce the impact of any single asset’s performance on the overall portfolio. By investing in a variety of assets — such as stocks, bonds, commodities, and real estate — investors can potentially achieve a more stable return profile.
The fundamental idea is that not all investments move in the same direction at the same time. When one asset’s return decreases, another’s might increase, thereby balancing the overall outcome. This interplay between assets’ returns is quantified using the correlation coefficient — a statistical measure that lies at the heart of diversification analysis.
The Role of Correlation in Portfolio Diversification
Correlation measures the degree to which two assets move together. It ranges between –1 and +1:
- A correlation of +1 means the assets move perfectly in the same direction.
- A correlation of –1 means they move exactly in opposite directions.
- A correlation of 0 means there is no linear relationship between their movements.
In the context of investment management, these values are crucial. Assets that are negatively correlated or have low positive correlations are ideal for diversification because they can help reduce overall portfolio volatility.
For example, during market downturns, government bonds might increase in value while equities fall. Holding both in a portfolio creates a natural hedge, which reduces total risk.
Thus, understanding how correlation works is essential for solving assignments related to portfolio management, financial analysis, and risk management.
Why Correlation Matrix is Used
A correlation matrix is a compact and organized way to display the correlation coefficients between multiple variables — in this case, different assets.
It’s a symmetric table where:
- Each row and column represent a different asset.
- The diagonal values (where an asset is compared with itself) are always 1.
- Off-diagonal values show the correlation between different assets.
In portfolio analysis, the correlation matrix helps visualize how all assets relate to one another at once, making it easier to identify diversification opportunities.
For instance, a portfolio with assets that all have correlations close to +1 will not benefit much from diversification. Conversely, a portfolio with mixed or negative correlations will be more resilient to market shocks.
Steps to Create a Correlation Matrix
Creating a correlation matrix is both a statistical and computational exercise. Here’s a structured approach you can follow for your assignments:
Step 1: Collect Asset Return Data
The first step is gathering historical return data for the selected assets. This data can come from:
- Stock market indices (e.g., S&P 500, NASDAQ)
- Individual company stocks
- Bonds, ETFs, or mutual funds
- Commodities or currencies
Make sure you have a consistent time frame (e.g., monthly returns over 3 years) and the same number of observations for each asset.
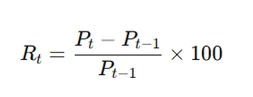
Step 2: Calculate Individual Returns
If only price data is available, compute periodic returns using the formula:
Where:
- (R_t) = return at time t
- (P_t) = price at time t
- (P_t-1 = price at previous period
You can use Excel, R, Python, or even financial calculators for this step.
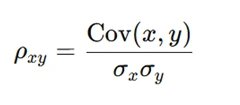
Step 3: Compute Pairwise Correlations
Once you have the return data, calculate the correlation coefficient for each pair of assets using the Pearson correlation formula:
Where:
- Cov(x, y) = Covariance between the two asset returns
- σₓ, σᵧ = Standard deviations of the asset returns
Most assignments allow the use of software tools. In Excel, you can use:
=CORREL(array1, array2)
In Python, use:
import pandas as pd
	df.corr()
Step 4: Construct the Correlation Matrix
Once all pairwise correlations are computed, arrange them in a table. For example:
| Asset | A | B | C |
|---|---|---|---|
| A | 1.00 | 0.45 | -0.20 |
| B | 0.45 | 1.00 | 0.10 |
| C | -0.20 | 0.10 | 1.00 |
This table is your correlation matrix. It visually summarizes the strength and direction of relationships among all assets.
Interpreting the Correlation Matrix
This is the most critical part of your assignment — interpreting what the numbers mean for portfolio construction.
- High Positive Correlations (> 0.7): Assets move together; little diversification benefit.
- Moderate Correlations (0.3–0.7): Some diversification benefit; assets are related but not perfectly.
- Low or Negative Correlations (< 0.3): Strong diversification advantage; assets often offset each other’s movements.
Let’s say you are analyzing three assets: Apple, Tesla, and Gold. If Apple and Tesla have a correlation of 0.85 (high positive), but Gold has correlations of 0.05 and –0.10 with them respectively, including Gold will significantly improve the portfolio’s risk-return profile.
Assignments often ask for:
- Identification of pairs with the lowest correlation (best diversification).
- Comment on portfolio risk implications.
- Discussion on investment management strategies based on findings.
Applying Correlation Analysis to Portfolio Optimization
Once the correlation structure is known, the next step is using it to optimize the portfolio. This involves selecting asset weights to achieve the best trade-off between risk and return.
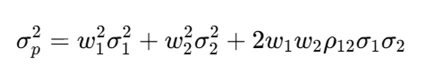
Step 1: Portfolio Variance Formula
The total risk (variance) of a two-asset portfolio is given by:
Where:
- (w_1, w_2) = weights of each asset
- (σ_1, σ_2) = standard deviations of asset returns
- (ρ_12) = correlation between the two assets
As correlation decreases, the third term (2w₁w₂ρ₁₂σ₁σ₂) reduces, leading to a lower overall portfolio risk — the mathematical proof of diversification.
Step 2: Efficient Frontier
By adjusting weights and correlations, investors can plot an efficient frontier, which shows the best possible expected return for a given level of risk.
Assignments may ask students to:
- Use the correlation matrix to simulate portfolio combinations.
- Identify the minimum-variance portfolio.
- Discuss how correlation impacts the efficient frontier shape.
Using Financial Modeling Tools
Assignments on portfolio diversification often require hands-on analysis in tools like Excel, R, or Python. Here’s how each can be used:
Excel
Excel is ideal for beginners. You can:
- Import price data.
- Compute returns and correlation using built-in formulas.
- Visualize results through conditional formatting or heatmaps.
R
R offers advanced statistical and visualization capabilities. Using functions like cor() or ggcorrplot, you can compute and plot correlation matrices easily.
Example:
cor_matrix <- cor(data)
	ggcorrplot(cor_matrix, lab = TRUE)
Python
Python’s pandas and numpy libraries are widely used for financial analysis. You can create correlation matrices, run portfolio simulations, and visualize correlations using seaborn heatmaps.
Example:
import seaborn as sns
	sns.heatmap(df.corr(), annot=True, cmap='coolwarm')
These tools enhance your assignment by providing professional-level analytics.
Integrating Correlation Analysis with Broader Financial Concepts
Portfolio diversification using a correlation matrix connects with several key finance topics:
- Portfolio Management: Helps design portfolios that align with investor risk tolerance.
- Investment Management: Aids in selecting assets for balanced performance.
- Financial Modeling: Uses statistical relationships to forecast risk and returns.
- Risk Management: Identifies asset combinations that minimize exposure.
- Financial Markets: Examines how macroeconomic factors influence asset correlations.
- Financial Management: Informs decision-making at institutional and corporate levels.
By connecting correlation analysis to these areas, your assignment becomes both quantitatively rigorous and financially meaningful.
Example Interpretation in a Report
When writing your report or assignment answer, structure it like this:
Introduction:
Briefly explain the importance of diversification and correlation analysis.
Data and Methodology:
Describe the assets chosen, time period, and methods used for calculating correlations.
Results:
Present the correlation matrix and highlight significant patterns:
“The correlation between Stock A and Stock B was 0.82, indicating strong co-movement, while Stock A and Gold showed a correlation of –0.12, suggesting potential diversification benefits.”
Discussion:
Explain implications:
“Including Gold in the portfolio reduces total volatility, as it tends to move inversely with equities during market downturns.”
Conclusion:
Summarize findings and recommend optimal diversification strategies.
Practical Application: Real-World Portfolio Example
Consider a portfolio of four assets:
- Apple (AAPL)
- ExxonMobil (XOM)
- US Treasury Bonds (BOND)
- Gold (GOLD)
After computing their correlations:
| Asset | AAPL | XOM | BOND | GOLD |
|---|---|---|---|---|
| AAPL | 1.00 | 0.65 | -0.20 | -0.10 |
| XOM | 0.65 | 1.00 | -0.25 | -0.15 |
| BOND | -0.20 | -0.25 | 1.00 | 0.05 |
| GOLD | -0.10 | -0.15 | 0.05 | 1.00 |
Interpretation:
- Equities (AAPL and XOM) are positively correlated.
- Bonds and Gold have weak or negative correlations with equities.
- Therefore, adding Bonds and Gold provides diversification benefits.
Such an example can form the backbone of your assignment’s analytical discussion.
Conclusion
Assignments on Portfolio Diversification using Correlation Matrix test your ability to blend statistical reasoning with financial judgment. They reflect how real-world portfolio managers use data-driven analysis to manage risk and maximize returns. By learning how to compute, interpret, and apply correlation matrices, you’re not just solving an academic problem — you’re developing a fundamental skill in investment management and financial analysis.
At StatisticsHomeworkHelper.com, we guide students step-by-step through complex topics like correlation analysis, financial modeling, and risk management. Whether you’re struggling to build your correlation matrix, interpret results, or write your assignment report, our experts are here to help you excel in your finance and statistics coursework with clarity and confidence.