How to Approach Hypothesis Testing in Statistical Assignments
.webp)
Claim Your Discount Today
Get 10% off on all Statistics homework at statisticshomeworkhelp.com! Whether it’s Probability, Regression Analysis, or Hypothesis Testing, our experts are ready to help you excel. Don’t miss out—grab this offer today! Our dedicated team ensures accurate solutions and timely delivery, boosting your grades and confidence. Hurry, this limited-time discount won’t last forever!
We Accept


- Understanding the Nature of the Data
- Hypothesis Testing for Proportions
- Hypothesis Testing for Means
- Confidence Intervals and Their Importance
- Correlation and Regression Analysis
- Conclusion
Statistical assignments demand a structured approach that balances theoretical knowledge and analytical skills. Whether dealing with hypothesis tests, confidence intervals, correlation, or regression, understanding statistical principles is key to accurate analysis. Many students seek statistics homework help to navigate the complexities of such assignments, ensuring they apply the correct methods and interpret results effectively. In particular, tasks involving proportion tests, t-tests, ANOVA, and regression models require precision and clarity to derive meaningful conclusions. A fundamental aspect of these assignments is hypothesis testing, where students often need help with hypothesis testing homework to formulate null and alternative hypotheses, select appropriate tests, and evaluate statistical significance. Properly analyzing data, considering confidence levels, and understanding causality versus correlation are essential skills for tackling statistical problems. By focusing on theoretical comprehension alongside computational execution, students can develop a structured approach to solving statistical assignments with accuracy and confidence.
Understanding the Nature of the Data

Understanding the dataset is the first step in statistical analysis. The dataset often consists of categorical and numerical variables, each requiring different statistical techniques. Categorical data, such as facility type and insurance status, require summary tables and proportion tests, whereas numerical data, such as total charges and length of stay, demand measures like mean, standard deviation, and regression analysis. Properly categorizing the data ensures the selection of the right statistical method, allowing meaningful insights to be drawn.
Hypothesis Testing for Proportions
Hypothesis testing for proportions helps determine if a categorical variable behaves as expected within a population. A one-sample proportion test is useful when comparing a sample proportion to a benchmark, such as testing if weekend discharges are less than half of all discharges. A two-sample proportion test compares two groups, such as discharge rates between different hospitals. These tests rely on p-values and confidence intervals to support or reject claims, ensuring statistically valid conclusions. Hypothesis testing is fundamental in statistical analysis. When dealing with proportions, as in testing discharge rates across different hospitals, the process involves:
- Defining Hypotheses:
- Null Hypothesis H0: The proportion of discharges on weekends is equal to or greater than 50%.
- Alternative Hypothesis H1: The proportion of weekend discharges is less than 50%.
- Choosing the Test:
- A one-sample proportion test (z-test) is used when comparing a sample proportion to a known benchmark.
- A two-sample proportion test compares proportions from two different groups (e.g., different hospitals).
- Significance Level and p-value:
- The significance level (α) is usually set at 0.01 or 0.05.
- The p-value determines whether to reject H0. If p-value < α, H0 is rejected.
- Conclusion:
- Interpret results in the context of the problem, ensuring clarity in real-world implications.
Hypothesis Testing for Means
Testing claims about population means is a critical part of statistical analysis. A one-sample t-test evaluates whether a sample mean differs significantly from a known population mean, such as assessing whether the average hospital charge is below $19,000. A two-sample t-test compares the means of two independent groups, such as hospital charges under different insurance providers. When analyzing multiple groups, ANOVA determines if differences exist among them, highlighting variations in sample means. Assignments often involve testing claims about population means, such as average hospital charges. The procedure follows a similar structure:
- One-Sample t-Test:
- Used when comparing a sample mean to a known population mean.
- For instance, testing if the mean hospital charge is less than $19,000.
- Two-Sample t-Test:
- Compares means between two independent groups (e.g., Blue Cross vs. Medicaid insurance).
- ANOVA (Analysis of Variance):
- Determines if there is a significant difference between multiple group means (e.g., different hospitals).
- Interpreting Results:
- The p-value provides evidence for or against the claim.
- Confidence intervals can offer additional insights.
Confidence Intervals and Their Importance
Confidence intervals provide a range within which the true population parameter likely falls. For example, a 99% confidence interval for hospital charges gives an estimated range where the actual mean charge is expected to be. These intervals enhance hypothesis testing by quantifying uncertainty and offering a broader perspective beyond a single sample estimate. By using confidence intervals, statisticians can make more informed decisions and draw meaningful conclusions. A confidence interval provides an estimated range for a population parameter. When constructing confidence intervals:
- Determine the Confidence Level:
- A 99% confidence level implies that the true mean falls within the interval 99% of the time.
- Compute the Interval:
- The formula for the confidence interval of a mean is:
- Interpretation:
- If an interval for total hospital charges is [18,500, 19,500], we conclude that the mean charge is likely within this range.
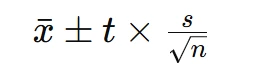
where x̄ is the sample mean, s is the standard deviation, n is the sample size, and t is the critical value.
Correlation and Regression Analysis
Understanding relationships between variables is crucial for data interpretation. Correlation analysis measures the strength of association between two numerical variables, such as the link between hospital stay duration and total charges. Regression analysis extends this by predicting one variable based on another, using a linear equation to estimate outcomes. However, correlation does not imply causation, as other underlying factors may influence the observed relationship. Proper interpretation of correlation and regression results is essential for accurate statistical conclusions. Understanding relationships between variables is essential in statistical assignments. Correlation and regression help explore associations, such as between the length of hospital stay and total charges.
- Correlation Analysis:
- Measures the strength and direction of a relationship.
- A correlation coefficient (r) close to 1 or -1 indicates a strong relationship, while near 0 suggests no correlation.
- Regression Analysis:
- Establishes a predictive model: Y = β₀ + β₁X + ε
- In hospital charge analysis, Y (total charge) may be predicted based on X (length of stay).
- Causality vs. Correlation:
- A strong correlation does not imply causation. External factors might influence both variables.
Conclusion
Solving statistical assignments requires a structured approach: understanding the dataset, selecting appropriate tests, correctly interpreting results, and providing meaningful conclusions. While computational aspects are important, theoretical comprehension ensures accuracy and clarity in statistical reasoning.