Understanding Hypothesis Testing in Biostatistics for Public Health Research
.webp)
Claim Your Discount Today
Get 10% off on all Statistics homework at statisticshomeworkhelp.com! Whether it’s Probability, Regression Analysis, or Hypothesis Testing, our experts are ready to help you excel. Don’t miss out—grab this offer today! Our dedicated team ensures accurate solutions and timely delivery, boosting your grades and confidence. Hurry, this limited-time discount won’t last forever!
We Accept


- 1. Understanding the Research Question and Study Design
- Key Considerations:
- 2. Selecting the Appropriate Statistical Test
- Scenario 1: Pre-Post Intervention Analysis (Paired t-test)
- Scenario 2: Longitudinal Data (Repeated Measures ANOVA)
- 3. Data Preparation and Assumption Checking
- 4. Conducting the Analysis and Interpreting Results
- Example: Beta-Endorphin Levels and Stress
- APA-Style Summary Table:
- 5. Reporting Results Effectively
- 6. Common Pitfalls and Solutions
- Conclusion
Navigating biostatistics homework can be challenging, especially when tasked with analyzing real-world public health data using advanced statistical methods like paired t-tests, repeated measures ANOVA, or longitudinal studies. Students often seek statistics homework help to decode research questions, select appropriate tests, and interpret results accurately—skills critical for assignments such as evaluating stress-induced changes in beta-endorphin levels or assessing cancer patients’ well-being post-intervention. Whether comparing pre- and post-surgery biomarker data or tracking oral health outcomes over multiple weeks, success hinges on a structured approach: defining hypotheses, validating assumptions (e.g., normality, sphericity), and reporting findings in APA style. For instance, a paired t-test examines mean differences in dependent samples, while repeated measures ANOVA identifies trends across time points, both requiring meticulous data preparation and contextual interpretation. Challenges like outliers or non-normal distributions demand robust solutions, such as non-parametric alternatives or data transformations. Those needing help with Biostatistics homework must also prioritize clarity in summarizing results—avoiding raw software outputs and instead crafting tables that highlight key metrics (means, SDs, p-values) and effect sizes. Understanding the practical implications of findings, such as how stress biomarkers inform clinical protocols or how telehealth interventions impact recovery, bridges statistical outcomes to public health relevance. By mastering these steps—hypothesis formulation, test selection, assumption checks, and concise reporting—students can confidently tackle assignments involving complex health datasets. Resources offering statistics homework help often emphasize these principles, empowering learners to transform data into actionable insights while avoiding pitfalls like misapplied tests or overlooked assumptions. Ultimately, excelling in biostatistics requires blending analytical rigor with contextual storytelling, ensuring results are both statistically sound and meaningful to real-world health challenges.
1. Understanding the Research Question and Study Design

Understanding the research question and study design is the foundation of any statistical analysis, particularly in biostatistics. It involves defining the hypothesis, identifying variables, and selecting the appropriate study design—whether it be a paired t-test for dependent samples, repeated measures ANOVA for tracking changes over time, or another suitable method. Properly distinguishing between dependent and independent groups ensures that statistical tests accurately capture relationships in the data. Additionally, recognizing temporal effects, such as trends in longitudinal studies, is essential for making informed analytical decisions. Every statistical analysis begins with a clear understanding of the research question and study design. For example:
- Paired (Dependent) t-test: Used when comparing two related measurements from the same subjects (e.g., beta-endorphin levels before and after stress induction in surgery patients).
- Repeated Measures ANOVA: Appropriate for evaluating changes in an outcome across three or more time points (e.g., oral health assessments at baseline, 2, 4, and 6 weeks in cancer patients).
Key Considerations:
- Dependent vs. Independent Groups: Paired tests account for within-subject variability, whereas independent tests compare distinct groups.
- Temporal Effects: Repeated measures designs track changes over time, requiring adjustments for sphericity or autocorrelation.
2. Selecting the Appropriate Statistical Test
Selecting the appropriate statistical test requires a clear understanding of the research objectives, sample type, and data structure. A paired t-test is used when comparing two related measurements from the same subjects, while repeated measures ANOVA analyzes variations across multiple time points. Each test has assumptions, such as normality and sphericity, that must be validated to ensure reliable results. Incorrect test selection can lead to misleading conclusions, underscoring the importance of aligning the statistical method with the study’s design and hypothesis.
Choosing the correct test hinges on the study design, data type, and research objective.
Scenario 1: Pre-Post Intervention Analysis (Paired t-test)
Suppose you are evaluating the effect of a stress-inducing event (e.g., surgery) on a biomarker. Here, measurements are taken from the same individuals at two time points. The paired t-test examines whether the mean difference between pairs is zero:

Where dˉ is the mean difference, sd the standard deviation of differences, and n the sample size.
Steps:
- Check Normality: Use Shapiro-Wilk or Q-Q plots to ensure differences are normally distributed.
- Conduct the Test: Calculate t-statistic and compare it to the critical value at α=0.01 (for strict significance thresholds).
- Report Effect Size: Cohen’s dd quantifies the magnitude of change.
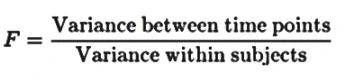
Scenario 2: Longitudinal Data (Repeated Measures ANOVA)
For studies with multiple follow-ups (e.g., oral health assessments over 6 weeks), repeated measures ANOVA evaluates whether means differ across time points. The F-statistic is computed as:
Steps:
- Assess Sphericity: Use Mauchly’s test; apply Greenhouse-Geisser correction if violated.
- Interpret Main Effects: If the F-test is significant, conduct post-hoc pairwise comparisons.
- Report Partial Eta-Squared: Indicates the proportion of variance explained by time.
3. Data Preparation and Assumption Checking
Data preparation and assumption checking are critical steps before conducting an analysis. Ensuring data completeness, handling missing values, and detecting outliers help maintain data integrity. Checking for normality using tools like Shapiro-Wilk tests or Q-Q plots, validating sphericity in repeated measures designs, and considering transformations or non-parametric alternatives when assumptions are violated are crucial practices. Proper preprocessing prevents errors that could affect the validity of statistical inferences.
Valid results depend on meeting statistical assumptions:
- Normality: Non-normal data may require non-parametric alternatives (e.g., Wilcoxon signed-rank test).
- Missing Data: Address dropouts or incomplete records via imputation or exclusion.
- Outliers: Use boxplots or Mahalanobis distance to identify and handle extreme values.
Example: In the beta-endorphin study, a paired t-test assumes that the differences between pre- and post-surgery levels are normally distributed. If outliers (e.g., ID 13’s 52.0 at 10 minutes) skew results, consider transformations or robust tests.
4. Conducting the Analysis and Interpreting Results
Conducting the analysis and interpreting results involves executing the chosen statistical test, computing test statistics, and determining significance levels. For instance, if a paired t-test reveals a significant difference in stress biomarker levels before and after surgery, it suggests a physiological response to stress. The interpretation should go beyond statistical significance, considering the real-world implications of findings in public health contexts.
After running tests, interpret results in the context of the research question.
Example: Beta-Endorphin Levels and Stress
- Hypotheses:
- H0: Mean difference (μd) = 0 (stress has no effect).
- H1: μd≠0 (stress increases beta-endorphin).
- Findings: If the t-test yields t=3.12, p=0.003 (less than α=0.01), reject H0. Beta-endorphin levels rise significantly before surgery.
APA-Style Summary Table:
| Variable | Pre-Surgery (M ± SD) | Post-Surgery (M ± SD) | Mean Difference | t(18) | p-value |
|---|---|---|---|---|---|
| Beta-Endorphin | 8.2 ± 4.3 | 16.7 ± 12.1 | 8.5 | 3.12 | 0.003 |
5. Reporting Results Effectively
Reporting results effectively requires clarity and adherence to standardized formats, such as APA style. Instead of raw statistical software outputs, well-structured tables presenting means, standard deviations, test statistics, p-values, and effect sizes enhance readability. Providing context for results—such as how changes in biomarkers influence clinical interventions—strengthens the study’s impact. Adhere to journal guidelines (e.g., APA) when creating tables and describing findings:
- Clarity: Avoid raw SPSS outputs; manually format tables with precise means, SDs, test statistics, and p-values.
- Contextualization: Link results to public health implications. For instance, stress-induced beta-endorphin surges might inform pain management protocols.
6. Common Pitfalls and Solutions
Common pitfalls in biostatistics include misapplying tests, neglecting key assumptions, and focusing solely on p-values while ignoring effect sizes. Using independent t-tests for dependent samples, failing to validate normality, or overlooking confidence intervals can lead to incorrect interpretations. Awareness of these challenges and applying corrective measures ensures more robust and credible analyses.
- Misapplying Tests: Using independent t-tests for paired data inflates Type I error rates.
- Ignoring Assumptions: Always validate normality and sphericity.
- Overlooking Effect Sizes: Statistical significance ≠ practical importance. Report confidence intervals.
Conclusion
Tackling biostatistics assignments requires a structured approach: define hypotheses, select tests aligned with the study design, validate assumptions, and present results clearly. By mastering these steps, students can confidently analyze public health datasets and contribute meaningful insights to real-world problems. Whether evaluating stress biomarkers or cancer patients’ well-being, the principles of rigorous statistical reasoning remain constant.