How to Solve Assignments on Data Analysis with R Specialization
Claim Your Discount Today
Get 10% off on all Statistics homework at statisticshomeworkhelp.com! Whether it’s Probability, Regression Analysis, or Hypothesis Testing, our experts are ready to help you excel. Don’t miss out—grab this offer today! Our dedicated team ensures accurate solutions and timely delivery, boosting your grades and confidence. Hurry, this limited-time discount won’t last forever!
We Accept


- Understanding the Data Analysis with R Specialization
- Installing and Using R and RStudio
- Data Wrangling and Exploratory Data Analysis (EDA)
- Statistical Reporting and Reproducibility
- Statistical Inference: From Probability to Hypothesis Testing
- Probability and Sampling
- Hypothesis Testing
- Regression Analysis and Statistical Modeling
- Simple Linear Regression
- Multiple Regression
- Model Diagnostics
- Data Visualization: Communicating Insights Effectively
- Bayesian Statistics and Modern Inference
- Understanding the Bayesian Framework
- Interpretation
- Statistical Communication and Reporting
- Peer Review and Critiquing Data-Based Decisions
- Advanced Topics: Unified Nature of Statistical Inference
- Bringing It All Together: Creating a Complete Analysis Pipeline
- Final Thoughts
In today’s data-driven world, mastering the ability to analyze and visualize data using R has become essential for students and professionals pursuing careers in statistics, data science, and applied analytics. The Data Analysis with R Specialization equips learners with practical skills in data interpretation, regression modeling, statistical inference, and effective communication of analytical results within the R ecosystem. At statisticshomeworkhelper.com, our team providing statistics homework help has assisted hundreds of students in successfully completing assignments related to this specialization. We emphasize not only the technical process but also the conceptual understanding behind each analytical step, ensuring students gain confidence in applying R to real-world problems. Through structured guidance, our experts explain data wrangling, hypothesis testing, and Bayesian analysis using R and RStudio while teaching how to create reproducible reports and compelling data visualizations. Whether you’re completing coursework, preparing for an online specialization, or handling a professional analytics project, our academic specialists can provide personalized help with R programming homework to enhance your comprehension and analytical performance. This guide outlines everything you need to know to solve complex R-based data analysis assignments efficiently and accurately while strengthening your foundation in modern statistical reasoning.
Understanding the Data Analysis with R Specialization

Assignments in this specialization are designed to help students:
- Analyze and visualize data effectively.
- Perform hypothesis testing and interpret p-values correctly.
- Build and examine regression models for relationships among variables.
- Understand frequentist and Bayesian inference.
- Communicate and report findings clearly to clients or instructors.
- Use R and RStudio for reproducible and transparent data analysis workflows.
Before diving into complex modeling or hypothesis testing, it is crucial to have a solid understanding of R’s environment and the workflow of statistical analysis.
Installing and Using R and RStudio
The first step in most assignments is setting up your tools correctly. R is a programming language for statistical computing, while RStudio is the integrated development environment (IDE) that makes coding in R more organized and user-friendly.
Steps to set up:
- Download R from CRAN.
- Install RStudio Desktop (Free version) from RStudio’s website.
- Load essential packages for analysis.
Such as:
install.packages(c("tidyverse", "ggplot2", "dplyr", "readr", "tidyr", "broom", "bayesplot", "rstanarm"))
	library(tidyverse)
Import your dataset using:
data <- read.csv("dataset.csv")
These steps ensure that your R environment is ready for data wrangling, visualization, and statistical modeling.
Data Wrangling and Exploratory Data Analysis (EDA)
Before performing any statistical test, you must understand your dataset. This step, often called Exploratory Data Analysis (EDA), helps you uncover patterns, detect anomalies, and form hypotheses.
Key tasks:
- Identify variable types (categorical vs. numerical).
- Handle missing values using na.omit() or imputation.
Summarize key statistics:
summary(data)
Create initial plots to visualize distributions:
ggplot(data, aes(x = variable)) + geom_histogram(binwidth = 10)
Example:
If you’re analyzing exam scores across different schools, EDA can help you detect outliers, compare group means, and identify whether your data is normally distributed—an important assumption for many inferential methods.
Statistical Reporting and Reproducibility
Assignments often require you to report your findings as if communicating with a non-technical audience.
This means:
- Using plain language rather than statistical jargon.
- Reporting test statistics, confidence intervals, and p-values clearly.
- Creating reproducible reports using R Markdown:
install.packages("rmarkdown")
	rmarkdown::render("analysis_report.Rmd")
Tip: Always include both the R code and interpretation in your submissions. This demonstrates reproducibility — a key component of professional data analysis.
Statistical Inference: From Probability to Hypothesis Testing
To solve statistical assignments effectively, you need a conceptual understanding of statistical inference, which connects probability theory with real-world decision-making.
Probability and Sampling
Assignments often begin with probability distributions and sampling concepts. You might be asked to simulate random samples or estimate population parameters.
For example:
sample_data <- sample(data$height, 50, replace = TRUE)
	mean(sample_data)
Key distributions:
- Normal Distribution for continuous variables.
- Binomial Distribution for categorical outcomes.
- Poisson Distribution for count data.
Hypothesis Testing
Students are frequently tasked with comparing groups or testing relationships.
For example:
- t-test: Comparing means of two groups.
- ANOVA: Comparing means of more than two groups.
- Chi-square test: Testing independence between categorical variables.
Example:
t.test(data$score ~ data$group)
When reporting results:
- Include the test statistic, degrees of freedom, and p-value.
- Interpret results in context, e.g.,
“There is a statistically significant difference in average scores between the two groups (t(48) = 2.45, p = 0.018).”
Assignments may also include confidence intervals or effect size calculations, which provide more information than the p-value alone.
Regression Analysis and Statistical Modeling
Regression is a core component of the Data Analysis with R Specialization. These assignments test your ability to fit, interpret, and validate models.
Simple Linear Regression
Used when predicting a dependent variable (Y) from one independent variable (X).
model <- lm(Y ~ X, data = data)
	summary(model)
Key outputs to report:
- Coefficients (β₀ and β₁)
- R-squared (explained variance)
- p-values for predictors
Interpretation:
“A one-unit increase in X is associated with an average increase of β₁ in Y, holding other factors constant.”
Multiple Regression
When multiple predictors influence the outcome:
model2 <- lm(Y ~ X1 + X2 + X3, data = data)
	summary(model2)
Assignments might require checking multicollinearity using the car package:
library(car)
	vif(model2)
Model Diagnostics
Always validate assumptions:
- Linearity
- Homoscedasticity (constant variance)
- Normality of residuals
- Independence of errors
Plot diagnostics:
plot(model)
Advanced Tasks:
Some assignments extend to logistic regression, Poisson regression, or time series models, each requiring specific interpretation of coefficients and link functions.
Data Visualization: Communicating Insights Effectively
Data visualization is a crucial part of every R-based assignment. The ggplot2 package offers flexible tools for creating professional graphs.
Examples:
# Histogram
	ggplot(data, aes(x = age)) + geom_histogram(fill = "skyblue", bins = 20)
	# Scatter plot with regression line
	ggplot(data, aes(x = income, y = spending)) +
	geom_point() +
	geom_smooth(method = "lm", se = FALSE)
Assignments may also ask you to visualize correlations:
cor(data$X, data$Y)
	ggplot(data, aes(X, Y)) + geom_point() + geom_smooth(method = "lm")
Best practices:
- Label axes and include titles.
- Avoid clutter; focus on clarity.
- Combine plots and summaries in R Markdown for comprehensive reporting.
Bayesian Statistics and Modern Inference
Many advanced assignments include Bayesian analysis, which interprets probability as a measure of belief rather than frequency. This allows updating prior beliefs based on new evidence.
Understanding the Bayesian Framework
Bayes’ Theorem:
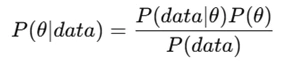
In R, packages like rstanarm or brms make Bayesian modeling accessible.
Example:
library(rstanarm)
	bayes_model <- stan_glm(Y ~ X, data = data, family = gaussian())
	summary(bayes_model)
Interpretation
Instead of a p-value, you’ll interpret the posterior distribution:
“There is a 95% probability that the coefficient for X lies between 0.45 and 1.25.”
Assignments may ask you to visualize posterior distributions using:
library(bayesplot)
	mcmc_areas(as.matrix(bayes_model), prob = 0.95)
This approach enhances understanding of uncertainty and inference beyond classical statistics.
Statistical Communication and Reporting
One of the learning outcomes of this specialization is communicating statistical results clearly and effectively. Students often lose marks not for incorrect analysis, but for poor reporting.
Checklist for effective reporting:
- Begin with a concise introduction, define research question and hypothesis.
- Include methods, specify data sources, sample size, and statistical tools.
- Present results with confidence intervals and visual aids.
- Discuss interpretations in context (avoid technical jargon).
- Conclude with implications and potential limitations.
Example format:
“A linear regression model was fitted to predict customer spending based on age and income. Results indicated that both predictors were significant (p < 0.05). Income had a stronger influence (β = 0.62) compared to age (β = 0.25). The model explained 72% of the variance (R² = 0.72).”
Assignments emphasizing communication skills may also require peer review or critique of others’ analyses — testing your ability to evaluate data-based claims objectively.
Peer Review and Critiquing Data-Based Decisions
As part of academic assignments or online coursework, students are often asked to review another student’s analysis. This tests critical thinking and statistical reasoning.
When conducting a peer review:
- Verify the correct use of statistical methods.
- Check for misinterpretation of p-values or overreliance on them.
- Assess if graphs are clear and data-supported.
- Recommend better visualization or modeling techniques if needed.
- Ensure reproducibility — results should be replicable from the shared code.
Providing constructive feedback demonstrates your understanding of statistical reporting ethics and data transparency.
Advanced Topics: Unified Nature of Statistical Inference
Assignments in the Data Analysis with R Specialization often bridge frequentist and Bayesian approaches, emphasizing their unified goal — making informed, data-based decisions.
Key takeaways:
- Frequentist inference relies on long-run probabilities (e.g., p-values).
- Bayesian inference updates beliefs with new data.
- Both approaches can be implemented in R for complementary insights.
For example, a frequentist regression and a Bayesian regression might lead to similar conclusions but different interpretations of uncertainty — an important distinction for analytical maturity.
Bringing It All Together: Creating a Complete Analysis Pipeline
A well-structured assignment should include the following components:
| Step | Description | Example Tools in R |
|---|---|---|
| 1. Data Import & Cleaning | Load and preprocess data | readr, dplyr |
| 2. EDA | Visualize and summarize data | ggplot2, summary() |
| 3. Statistical Inference | Conduct hypothesis testing | t.test(), aov() |
| 4. Modeling | Fit regression or Bayesian models | lm(), rstanarm |
| 5. Diagnostics | Validate model assumptions | plot(), vif() |
| 6. Visualization | Present results effectively | ggplot2, corrplot |
| 7. Reporting | Communicate findings | rmarkdown |
This pipeline ensures that your analysis is transparent, reproducible, and insightful — essential qualities for both academic assignments and professional reporting.
Final Thoughts
Assignments in Data Analysis with R Specialization are designed not only to test your statistical skills but also to prepare you for real-world data analysis challenges. By mastering the use of R and RStudio, understanding the principles of statistical inference, and presenting your findings clearly, you can excel in this specialization and beyond.
At StatisticsHomeworkHelper.com, our experts specialize in guiding students through complex R-based assignments — from basic probability to advanced Bayesian inference. Whether you’re stuck on regression diagnostics, data visualization, or hypothesis interpretation, we can help you produce clear, accurate, and professional-quality statistical reports.
Remember: great data analysis doesn’t just involve running code — it involves understanding, interpreting, and communicating the story behind the numbers.