Determining Appropriate Statistical Inference Tests
The solutions below answer various types of questions on hypothesis testing. While some identify the right statistical tests that suit each described situation in the questions, others perform the tests to make accurate decisions. Here we go.
Identification of The Right Test to Undertake
A researcher wants to study the relationship between viewing violent television and aggressive behavior of boys aged 5 years. Television preferences are obtained by interviewing each child. Based on the interview results, the boys are divided into two groups: those who prefer violent television and those who prefer non-violent television. Then aggressive behavior is measured by observing the children during an outdoor play period to determine if there is any difference between the two groups.
(a). What is/are the independent variable(s)?
The independent variable is a preference for the type of television program
(b) What are the levels of each independent variable?
The levels of the preference for the type of television program has two levels: violent television programs and non-violent television programs
(c) What is the scale of measurement of the independent variable?
The scale of measurement of the independent variable is nominal
(d) What is the dependent variable?
The dependent variable is the measure of aggressive behavior
(e) What is the scale of measurement of the dependent variable?
The dependent variable is a continuous variable, so it can be measured using an interval variable.
(f) What is the appropriate hypothesis test to analyze the data? Explain.
The appropriate hypothesis test to be used is the independent samples t-test. We have two independent groups of kids, and we are testing whether the average value of a metric, in this scenario, measure of aggressive behavior, is equal across the two groups. The independent samples t-test can be used to test the hypothesis.
(a) A statistics professor wants to know if there is a relationship between time spent in tutoring and final exam scores.
Pearson’s correlation coefficient test can be used to test if there is a relationship between time spent in tutoring and final exam scores, as we are measuring if there is a relationship between two continuous variables.
(b) A psychologist wants to determine if a psychoeducation program before beginning therapy has a significant impact on the anxiety levels of schizophrenic patients. The anxiety levels for a group of 12 participants are measured before and after therapy.
Paired samples t-test can be used to test the hypothesis.
(c) A sociology professor measures the relationship between gender (male, female) and salaries in order to study wage gaps.
Independent samples t-test can be used to test the hypothesis.
(d) A researcher wants to study if social media activity (activity, no activity) has a significant impact on self-esteem (low, high).
The Chi-square test of independence can be used to test the hypothesis, as we are measuring whether there is a significant relationship between two categorical variables.
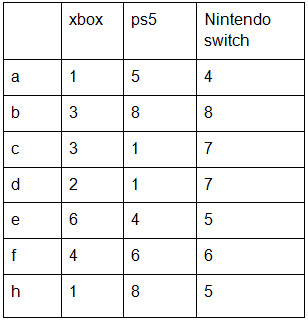
A researcher studied the happiness level of teenager-boys from receiving a game console during the Christmas holiday. Three independent samples of individuals were given particular game consoles that are shown in the data below. Using an ANOVA with α=0.05, determine whether there are significant differences in happiness level among the three-game consoles. Please show all your works and statistic information.
Performing an ANOVA Test
a. Perform a complete hypothesis test to determine whether there are any significant differences among the three groups. Test at the .05 level of significance. SHOW ALL YOUR WORK
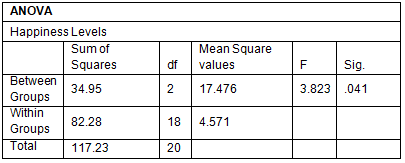
We will use the one-way ANOVA to test the hypothesis.
The significance level to be used for the hypothesis test is 0.05
The degrees of freedom are (k-1, N-k) = (3-1, 21-3) = (2, 18)
Where k is the number of groups and N is the total sample size for the study
Sample mean of X Box = (1+3+3+2+6+4+1)/7 = 2.857
Similarly, the sample mean of PS5 is 4.7143, and the sample mean of Nintendo Switch is 6.
Sample SD of X-box = SQRT (Σ(X – Mean)2/N-1) = 1.77
Sample SD of PS 5= SQRT (Σ(X – Mean)2/N-1) = 2.93
Sample SD of Nintendo Switch = SQRT (Σ(X – Mean)2/N-1) = 1.41
Total group mean (X-bar) = (Sum of all numbers)/21 = (2.857*7 + 4.7143*7 + 6*7)/21 = 4.524
SS (Between groups) = Σn*(X- X-bar)2 = 7*(2.857-4.524)2 + 7*(4.714 -4.524)2 + 7*(6 -4.524)2
SS (Between groups) = 34.95
SS (Within groups) = Σ(n-1)*s2 = 6*1.772 + 6*2.932 + 6*1.412 = 18.86 + 51.42 + 12 ~ 82.28
Using the values of SS (Between groups), SS (Within groups), we can compute
MS (Between groups) = SS (Between groups)/2
MS (Within groups) = SS (Within groups)/18
F-value = MS (Between groups)/ MS (Within groups) = 3.823
P-value is equal to 0.041
Thus, at a 0.05 significance level, we reject the null hypothesis
b. Do you need to perform post hocs? Explain but do not compute the post hocs.
As the p-value of the one way ANOVA is less than 0.05, we need to perform post hocs
c. Compute effect size.
The effect size can be computed using the eta-squared value.
Eta-squared value = SS (Between groups)/ SS (Total) = 34.95/117.23 = 0.298.
The eta-squared value is greater than 0.298, so the effect size can be termed as large.
d. Summarize your findings in a source table.
e. Write an interpretation of our results in APA-format (include means and SDs in your interpretation)
A one-way ANOVA was conducted to test the hypothesis that the average happiness levels of teenage boys receiving gaming consoles (Xbox, PS5, Nintendo Switch) during Christmas. The results indicate that there is a significant difference in happiness levels across the three groups of boys, F(2,18) = 3.823, p-value = 0.041 < 0.05. The average happiness levels of teenage boys receiving Nintendo Switch is the highest (mean = 6, SD = 1.41), followed by PS 5 (mean = 4.71, SD = 2.93) and least average happiness levels if for those who received Xbox (Mean = 2.86, SD = 1.77).