-
Home
-
Conducting a Chi Square Test using SPSS to Analyze the Benefits of Exercise on Wellbeing Assignment Solution.
Assignment Instructions
Questionnaire Guidelines – Creation, collection, input & analysis of a research topic.
- You are required to produce a report based on the results from a questionnaire designed for the purposes of this assignment, keeping it a simple, harmless topic.
- The questionnaire should be based on a topic of your choice. You must agree on the topic with your workshop tutor BEFORE you actually interview any respondents.
- The questionnaire should include a title and a brief introductory statement outlining the topic and must be respondent self-completion.
- Include a minimum of 10 questions in the questionnaire, each of which must count as a variable. One question must be on gender and one on age. Age must be measured in exact years. The remaining variables are dependent variables and should contain a mix of ordinal, nominal, and interval variables.
- Conduct the questionnaire on no fewer than 20 respondents (e.g. 10 male and 10 female). You should explain the purpose of the questionnaire to each respondent and seek her/his agreement to participate. It is the right of the respondent to refuse your request and under no circumstances must you pressurize them into partaking. Your sample should be friends and family or other students over the age of 18.
- Gender & age are your I.V. (Independent variables) as you will be comparing male & female, & age responses.
- Using the “transform” tag create a new variable: age ranges (for example, young (0 - 35), middle-aged (36 – 64), and old (65 upwards).
- Enter the data from your questionnaire into SPSS and carry out the following
types of analysis on your data set:
- Frequency distribution for each of the variables, including the new age variable.
- The appropriate MCT for each of the variables.
- Mean, standard deviation, median, mode, and range for original age variable.
- Cross tabulation of each of the dependent variables (Row) by gender and age recoded variable (I.V., Column, Manipulated). For each cross-tabulation include both a relevant test of statistical significance (Chi-Square) and a measure of association (phi / Cramer’s V).
9. Create a Questionnaire Results file on a word document.
- The SPSS output presents a table or chart for each of the frequency distributions and the cross-tabulations.
- All tables and charts must be numbered and labeled.
- Each table and chart must have a short interpretative description decoding the results of that table or chart. State what the chart says, means, and or highlights.
Assignment Solution
Statistical Analysis of Benefits of Exercise on Well Being
Introduction
The positive role that physical exercise can play in human well-being and the treatment of a range of medical conditions has received a great deal of attention over recent years, with numerous high-profile reports supporting the popular message that exercise is good for the human body. In addition, research has identified the long-term protection that regular exercise affords against a plethora of somatic complaints, including coronary heart disease, hypertension, a number of cancers, diabetes, and osteoporosis. Unfortunately, while the somatic benefits associated with physical exercise are well documented, hard evidence to support an equivalent relation between exercise and human well-being is less plentiful. The purpose of the present study is therefore to explore the association between gender, age physical exercise frequency, and a number of measures of well-being.
Source of Data
The data used for this study is primary data collected by administering a questionnaire to the respondents. Various questions on age, gender and exercise frequency, and a number of measures of well-being were answered. The data were coded and analyzed using SPSS.
Descriptive Statistics
Frequency Distributions
Gender
| Frequency | Percent | Valid Percent | Cumulative Percent |
| Valid Male | 10 | 50.0 | 50.0 | 50.0 |
| Female | 10 | 50.0 | 50.0 | 100.0 |
| Total | 20 | 100.0 | 100.0 |
|
Activity level
| Frequency | Percent | Valid Percent | Cumulative Percent |
| Valid very active | 9 | 45.0 | 45.0 | 45.0 |
| active moderate | 11 | 55.0 | 55.0 | 100.0 |
| Total | 20 | 100.0 | 100.0 |
|
Importance of exercise
| Frequency | Percent | Valid Percent | Cumulative Percent |
| Valid very important | 18 | 90.0 | 90.0 | 90.0 |
| important | 2 | 10.0 | 10.0 | 100.0 |
| Total | 20 | 100.0 | 100.0 |
|
How often exercise
| Frequency | Percent | Valid Percent | Cumulative Percent |
| Valid once a week | 3 | 15.0 | 15.0 | 15.0 |
| twice a week | 8 | 40.0 | 40.0 | 55.0 |
| more than three times a week | 8 | 40.0 | 40.0 | 95.0 |
| not at all | 1 | 5.0 | 5.0 | 100.0 |
| Total | 20 | 100.0 | 100.0 |
|
Sleeping better after exercise?
| Frequency | Percent | Valid Percent | Cumulative Percent |
| Valid yes | 19 | 95.0 | 95.0 | 95.0 |
| no | 1 | 5.0 | 5.0 | 100.0 |
| Total | 20 | 100.0 | 100.0 |
|
Do you compare yourself to others?
| Frequency | Percent | Valid Percent | Cumulative Percent |
| Valid yes | 2 | 10.0 | 10.0 | 10.0 |
| no | 14 | 70.0 | 70.0 | 80.0 |
| sometimes | 4 | 20.0 | 20.0 | 100.0 |
| Total | 20 | 100.0 | 100.0 |
|
Satisfaction with your life
| Frequency | Percent | Valid Percent | Cumulative Percent |
| Valid very satisfied | 9 | 45.0 | 45.0 | 45.0 |
| satisfied | 11 | 55.0 | 55.0 | 100.0 |
| Total | 20 | 100.0 | 100.0 |
|
Define your mental health status
| Frequency | Percent | Valid Percent | Cumulative Percent |
| Valid good | 10 | 50.0 | 50.0 | 50.0 |
| poor | 1 | 5.0 | 5.0 | 55.0 |
| excellent | 9 | 45.0 | 45.0 | 100.0 |
| Total | 20 | 100.0 | 100.0 |
|
The measure of Central Tendency
The table below gives the summary of each question included in the study, their level of measurement, and the appropriate measure of central tendency. The appropriate measure of tendency used for scale measurement is mean, nominal measurement is mode and ordinal measurement is Median.
| ID | Question | Level of Measurement | Central Tendency | Value |
| Question 1 | What is your age? | Scale | Mean | 42.85 |
| Question 2 | What is your gender? | Nominal | Mode | Female, Male (Bi-Modal) |
| Question 3 | How active do you consider yourself? | Ordinal | Median | 2 (Active Moderate) |
| Question 4 | In your opinion how important is exercise? | Ordinal | Median | 1 (Very Important) |
| Question 5 | How often do you exercise a week? | Ordinal | Median | 2 (Twice a week)
|
| Question 6 | After a session of exercise do you sleep better? | Nominal | Mode | 1 (Yes) |
| Question 7 | Do you compare yourself to others? | Nominal | Mode | 2 (No) |
| Question 8 | Are you satisfied with your life? | Ordinal | Median | 2 (Satisfied) |
| Question 9 | How you would define your emotional and mental status? | Ordinal | Median | 1.5 |
| Question 10 | Do you agree exercise helps support emotional and mental health? | Ordinal | Median | 3 (Strongly Agreed) |
| Recorded Age | Age Group | Ordinal | Median | 3 (36-45 Years) |
The tables below give the descriptive statistics for the age of the participants
Age
| N Valid | 20 |
| Missing | 0 |
| Mean | 42.85 |
| Median | 42.00 |
| Mode | 42a |
| Std. Deviation | 9.837 |
| Range | 38 |
a. Multiple modes exist. The smallest value is shown
The table above shows that the average age of the respondent is 42.85 with a standard deviation of 9.837. Majority of our 42 years and difference between the maximum and the minimum age was obtain to be 38.
Cross-Tabulation and Chi-Square
The chi-square test of independence is used to determine if there is a significant relationship between two categorical variables. For this analysis, we test for the dependency of the participant's response on each question on Age and gender.
Dependency on Age
The hypothesis and rejection rule are given below;
Null hypothesis: There is no association between the participant's age and their response to the question (i.e they are independent)
Alternative hypothesis: There is an association between the participant's age and their response to the question (i.e they are dependent)
Rejection rule: Reject the null hypothesis if the p-value is less than 0.05
The results for the association between participant age and response to each question are given below;
How active do you consider yourself?
Activity level * Age group Crosstabulation
Count
|
|
| Age group |
|
|
|
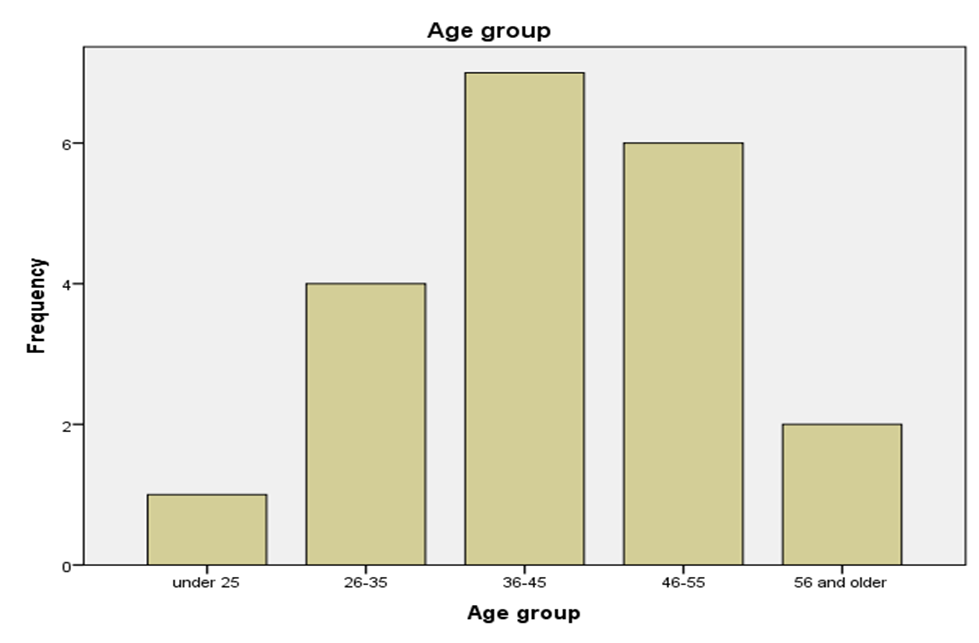
| under 25 | 26-35 | 36-45 | 46-55 | 56 and older | Total |
| Activity level very active | 0 | 2 | 2 | 4 | 1 | 9 |
| active moderate | 1 | 2 | 5 | 2 | 1 | 11 |
| Total | 1 | 4 | 7 | 6 | 2 | 20 |
| Value | df | Asymp. Sig. (2-sided) |
| Pearson Chi-Square | 2.780a | 4 | .595 |
| Likelihood Ratio | 3.194 | 4 | .526 |
| Linear-by-Linear Association | .876 | 1 | .349 |
| N of Valid Cases | 20 |
|
|
a. 10 cells (100.0%) have an expected count of less than 5. The minimum expected count is .45.
Symmetric Measures
| Value | Approx. Sig. |
Nominal by Nominal
Phi
| 373 | .595 |
| Cramer's V | 373 | .595 |
| N of Valid Cases | 20 |
|
Decision: We do not reject the null hypothesis
In your opinion how important is exercise?
Importance of exercise * Age group Crosstabulation
Count
|
|
| Age group |
|
|
|
| under 25 | 26-35 | 36-45 | 46-55 | 56 and older | Total |
| Importance of exercise very important | 1 | 3 | 7 | 5 | 2 | 18 |
| important | 0 | 1 | 0 | 1 | 0 | 2 |
| Total | 1 | 4 | 7 | 6 | 2 | 20 |
| Value | df | Asymp. Sig. (2-sided) |
| Pearson Chi-Square | 2.780a | 4 | .595 |
| Likelihood Ratio | 3.194 | 4 | .526 |
| Linear-by-Linear Association | .876 | 1 | .349 |
| N of Valid Cases | 20 |
|
|
a. 10 cells (100.0%) have an expected count of less than 5. The minimum expected count is .45.
| Value | Approx. Sig. |
Nominal by Nominal
Phi
| .373 | .595 |
| Cramer's V | .373 | .595 |
| N of Valid Cases | 20 |
|
Decision: We do not reject the null hypothesis
In your opinion how important is exercise?
Importance of exercise * Age group Crosstabulation
Count
|
|
| Age group |
|
|
|
| under 25 | under 25 | under 25 | under 25 | 56 and older | Total |
| Importance of exercise very important | 1 | 3 | 7 | 5 | 2 | 18 |
| important | 0 | 1 | 0 | 1 | 0 | 2 |
| Total | 1 | 4 | 7 | 6 | 2 | 20 |
| Value | df | Asymp. Sig. (2-sided) |
| Pearson Chi-Square | 2.407a | 4 | .661 |
| Likelihood Ratio | 3.098 | 4 | .542 |
| Linear-by-Linear Association | .080 | 1 | .778 |
| N of Valid Cases | 20 |
|
|
a. 8 cells (80.0%) have an expected count of less than 5. The minimum expected count is .10.
Symmetric Measures
| Value | Approx. Sig. |
| Nominal by Nominal Phi | .347 | .661 |
| Cramer's V | .347 | .661 |
| N of Valid Cases | 20 |
|
Decision: We do not reject the null hypothesis
How often do you exercise a week?
How often exercise * Age group Crosstabulation
Count
| Gender | Gender |
|
| Male | Female | Total |
| How often exercise once a week | 0 | 3 | 3 |
| twice a week | 4 | 4 | 8 |
| more than three times a week | 5 | 3 | 8 |
| not at all | 1 | 0 | 1 |
| Total | 10 | 10 | 20 |
| Value | df | Asymp. Sig. (2-sided) |
| Pearson Chi-Square | 4.500a | 3 | .212 |
| Likelihood Ratio | 6.051 | 3 | .109 |
| Linear-by-Linear Association | 3.709 | 1 | .054 |
| N of Valid Cases | 20 |
|
|
a. 8 cells (100.0%) have an expected count of less than 5. The minimum expected count is .50.
Symmetric Measures
| Value | Approx. Sig. |
| Nominal by Nominal Phi | .474 | .212 |
| Cramer's V | .474 | .212 |
| N of Valid Cases | 20 |
|
Decision: We do not reject the null hypothesis
After a session of exercise do you sleep better?
Sleeping better after exercise? * Gender Crosstabulation
Count
| Gender | Gender | Total |
| Male | Female |
|
| Sleeping better after exercise? yes | 9 | 10 | 19 |
| no | 1 | 0 | 1 |
| Total | 10 | 10 | 20 |
| Value | df | Asymp. Sig. (2-sided) | Exact Sig. (2-sided) | Exact Sig. (1-sided) |
| Pearson Chi-Square | 1.053a | 1 | .305 |
|
|
| Continuity Corrections | 000 | 1 | 1.000 |
|
|
| Likelihood Ratio | 1.439 | 1 | .230 |
|
|
| Fisher's Exact Test |
|
|
| 1.000 | .500 |
| Linear-by-Linear Association | 1.000 | 1 | .317 |
|
|
| N of Valid Cases | 20 |
|
|
|
|
a. 2 cells (50.0%) have an expected count of less than 5. The minimum expected count is .50.
b. Computed only for a 2x2 table
| Value | Approx. Sig. |
| Nominal by Nominal Phi | -.229 | .305 |
| Cramer's V | -.229 | .305 |
| N of Valid Cases | 20 |
|
Decision: We do not reject the null hypothesis
Do you compare yourself to others?
Do you compare yourself to others? * Gender Crosstabulation
Count
| Gender | Gender |
|
| Male | Female | Total |
| Do you compare yourself to others? yes | 1 | 1 | 2 |
| no | 8 | 6 | 14 |
| sometimes | 1 | 3 | 4 |
| Total | 10 | 10 | 20 |
| Value | df | Asymp. Sig. (2-sided) |
| Pearson Chi-Square | 1.286a | 2 | .526 |
| Likelihood Ratio | 1.333 | 2 | .513 |
| Linear-by-Linear Association | .655 | 1 | .418 |
| N of Valid Cases | 20 |
|
|
a. 4 cells (66.7%) have an expected count of less than 5. The minimum expected count is 1.00.
Symmetric Measures
| Value | Approx. Sig. |
| Nominal by Nominal Phi | .254 | .526 |
| Cramer's V | .254 | .526 |
| N of Valid Cases | 20 |
|
Decision: We do not reject the null hypothesis
Are you satisfied with your life?
Satisfaction with your life * Gender Crosstabulation
| Gender | Gender |
|
| Male | Female | Total |
| Satisfaction with your life very satisfied | 6 | 3 | 9 |
| satisfied | 4 | 7 | 11 |
| Total | 10 | 10 | 20 |
| Value | df | Asymp. Sig. (2-sided) | Exact Sig. (2-sided) | Exact Sig. (1-sided) |
| Pearson Chi-Square | 1.818a | 1 | .178 |
|
|
| Continuity Correction | .808 | 1 | .369 |
|
|
| Likelihood Ratio | 1.848 | 1 | .174 |
|
|
| Fisher's Exact Test |
|
|
| .370 | .185 |
| Linear-by-Linear Association | 1.727 | 1 | .189 |
|
|
| N of Valid Cases | 20 |
|
|
|
|
a. 2 cells (50.0%) have an expected count of less than 5. The minimum expected count is 4.50.
b. Computed only for a 2x2 table
Symmetric Measures
| Value | Approx. Sig. |
| Nominal by Nominal Phi | .302 | .178 |
| Cramer's V | .302 | .178 |
| N of Valid Cases | 20 |
|
Decision: We do not reject the null hypothesis
How you would define your emotional and mental status?
Define your mental health status * Gender Crosstabulation
Count
| Gender | Gender |
|
| Male | Female | Total |
| Define your mental health status good | 4 | 6 | 10 |
| poor | 1 | 0 | 1 |
| excellent | 5 | 4 | 9 |
| Total | 10 | 10 | 20 |
| Value | df | Asymp. Sig. (2-sided) |
| Pearson Chi-Square | 1.511a | 2 | .470 |
| Likelihood Ratio | 1.900 | 2 | .387 |
| Linear-by-Linear Association | .451 | 1 | .502 |
| N of Valid Cases | 20 |
|
|
a. 4 cells (66.7%) have an expected count of less than 5. The minimum expected count is .50.
Symmetric Measures
| Value | Approx. Sig. |
| Nominal by Nominal Phi | .275 | .470 |
| Cramer's V | .275 | .470 |
| N of Valid Cases | 20 |
|
Decision: We do not reject the null hypothesis
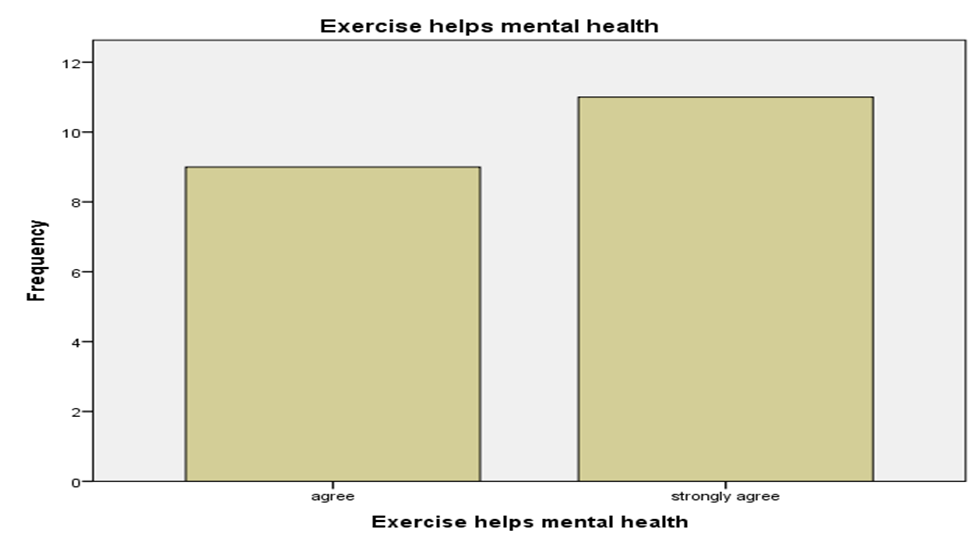
Do you agree exercise helps support emotional and mental health?
Exercise helps mental health * Gender Crosstabulation
Count
| Gender | Gender |
|
| Male | Female | Total |
| Exercise helps mental health agree | 3 | 6 | 9 |
| strongly agree | 7 | 4 | 11 |
| Total | 10 | 10 | 20 |
| Value | df | Asymp. Sig. (2-sided) | Exact Sig. (2-sided) | Exact Sig. (1-sided) |
| Pearson Chi-Square | 1.818a | 1 | .178 |
|
|
| Continuity Correction | .808 | 1 | .369 |
|
|
| Likelihood Ratio | 1.848 | 1 | .174 |
|
|
| Fisher's Exact Test |
|
|
| .370 | .185 |
| Linear-by-Linear Association | 1.727 | 1 | .189 |
|
|
| N of Valid Cases | 20 |
|
|
|
|
a. 2 cells (50.0%) have an expected count of less than 5. The minimum expected count is 4.50.
b. Computed only for a 2x2 table
Symmetric Measures
| Value | Approx. Sig. |
| Nominal by Nominal Phi | -.302 | .178 |
| Cramer's V | -.302 | .178 |
| N of Valid Cases | 20 |
|
Decision: We do not reject the null hypothesis
Conclusion
The study was carried out to investigate the association between gender, age, physical exercise frequency, and a number of measures of well-being. The chi-square test of independence was performed and the results revealed that there is no significant association between the measures of well-being included in the study, age, and gender. That is, the participant's response to each of the questions is independent of their gender and age.