Assignment on to Find Residual Analysis
Predicting Chance of Admission
August 7, 2021
Introduction
This work is aimed at formulating a predictive model for forecasting the chances of getting admission putting into consideration some other explanatory variables which are listed in the next section. The dataset contains 400 sets of students' information ranging from their TOEFL scores, and CGPA, among others.
Data Description
The following is the description of all the variables in the dataset collected from 400
students.
GRE.Score: This is the student's score in GRE
TOEFL.Score: TOEFL score of the students
University.Rating: The rating of students by the University
SOP
LOR
CGPA: Cumulative Grade Point Average
Research: Representing if students have done any research work before the study
Chance. of.Admit: The chance of students getting admission
dat=read.csv("admision.csv")
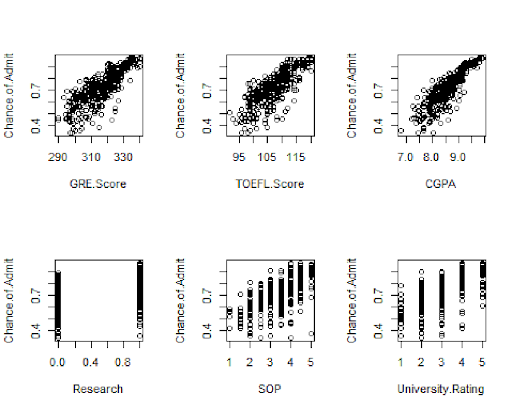
The scatter plots above indicate that the dataset has no missing values as well as outliers.
This gives us a go-ahead in the modlling of the data.
## GRE.ScoreTOEFL.ScoreUniversity.Rating SOP
LOR
## GRE.Score 1.0000000 0.8359768 0.6689759 0.6128307
0.5575545
## TOEFL.Score 0.8359768 1.0000000 0.6955898 0.6579805
0.5677209
## University.Rating 0.6689759 0.6955898 1.0000000 0.7345228
0.6601235
## SOP 0.6128307 0.6579805 0.7345228 1.0000000
0.7295925
## LOR 0.5575545 0.5677209 0.6601235 0.7295925
1.0000000
## CGPA 0.8330605 0.8284174 0.7464787 0.7181440
0.6702113
## Research 0.5803906 0.4898579 0.4477825 0.4440288
0.3968593
## Chance.of.Admit 0.8026105 0.7915940 0.7112503 0.6757319
0.6698888
## CGPA Research Chance.of.Admit
## GRE.Score 0.8330605 0.5803906 0.8026105
## TOEFL.Score 0.8284174 0.4898579 0.7915940
## University.Rating 0.7464787 0.4477825 0.7112503
## SOP 0.7181440 0.4440288 0.6757319
## LOR 0.6702113 0.3968593 0.6698888
## CGPA 1.0000000 0.5216542 0.8732891
## Research 0.5216542 1.0000000 0.5532021
## Chance. of.Admit 0.8732891 0.5532021 1.0000000
Since it has been confirmed that there exist linear relationships between the response
variable (Chance of admission) and the explanatory variables, we, therefore, need to break
our dataset into two groups where the first group will be used in testing the adequacy of
the model to be set up and the other dataset will be used for the prediction.
## The following objects are masked from date:
##
## CGPA, Chance. of.Admit, GRE.Score, LOR, SOP, TOEFL.Score,
## University.Rating
##
## Call:
## lm(formula = Chance.of.Admit ~ GRE.Score + TOEFL.Score + University.Rating
+
## CGPA + SOP + LOR, data = train)
##
## Residuals:
## Min 1Q Median 3Q Max
## -0.26231 -0.02965 0.01063 0.04823 0.15903
##
## Coefficients:
## Estimate Std. Error t value Pr(>|t|)
## (Intercept) -1.5419997 0.1785288 -8.637 2.16e-15 ***
## GRE.Score 0.0023330 0.0009709 2.403 0.017205 *
## TOEFL.Score 0.0042376 0.0019930 2.126 0.034754 *
## University.Rating 0.0073669 0.0069980 1.053 0.293791
## CGPA 0.1103004 0.0189598 5.818 2.45e-08 ***
## SOP -0.0057258 0.0081384 -0.704 0.482560
## LOR 0.0308114 0.0092193 3.342 0.000999 ***
## ---
## Signif. codes: 0 '***' 0.001 '**' 0.01 '*' 0.05 '.' 0.1 ' ' 1
##
## Residual standard error: 0.0753 on 193 degrees of freedom
## Multiple R-squared: 0.7745, Adjusted R-squared: 0.7674
## F-statistic: 110.5 on 6 and 193 DF, p-value: < 2.2e-16
Interpretation:
The value of R-squared= 0.7745 means that about 77.45% of the total variation in chance of
admission can be explained by the variables considered while about 22.54% are attributed
to other factors.
From the result above, it can be seen that variables "University Ratings" and "SOP" are not
significant in predicting chance of admission since the p-values are greater than 5% level of
significance; hence we remove these variables and try other variables with the second set
of data.
Residual Analysis based on Train data
## The following objects are masked from train (pos = 3):
##
## CGPA, Chance.of.Admit, GRE.Score, LOR, SOP, TOEFL.Score,
## University.Rating
## The following objects are masked from dat:
##
## CGPA, Chance.of.Admit, GRE.Score, LOR, SOP, TOEFL.Score,
## University.Rating
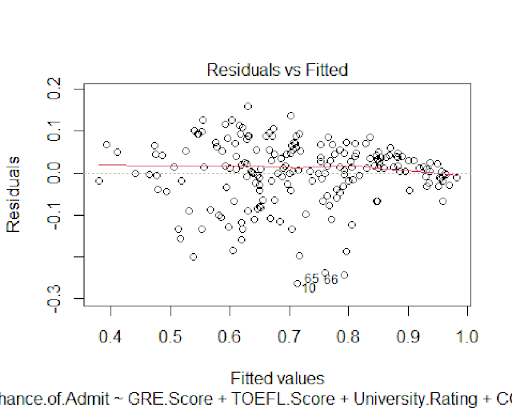
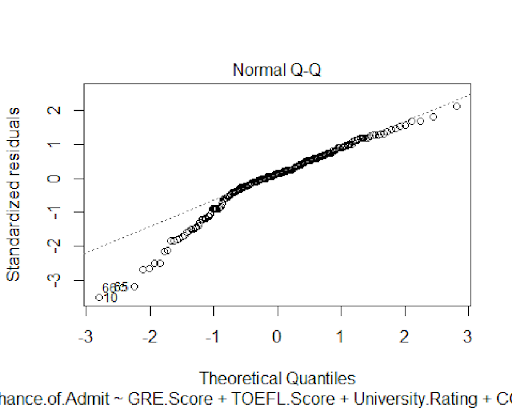
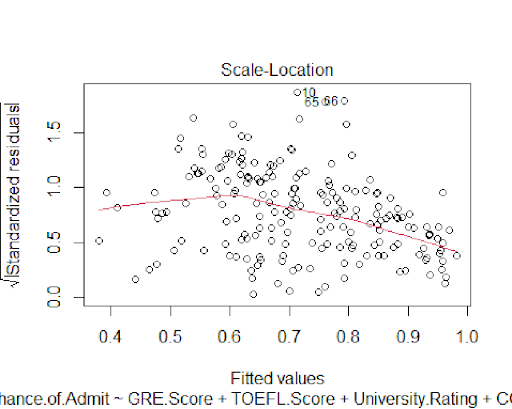
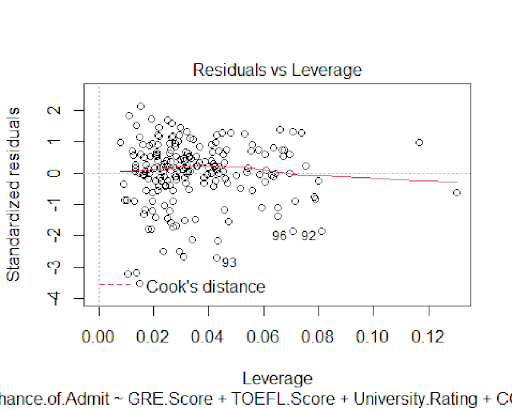
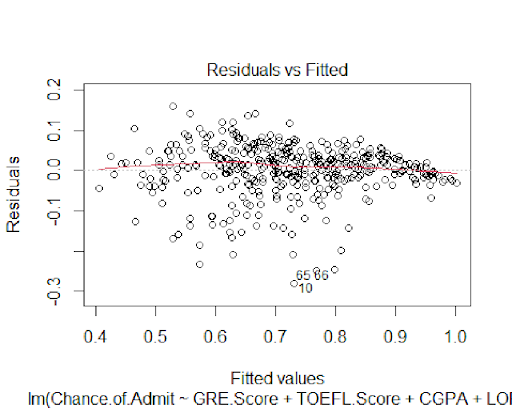
The residual plots indicate that the residuals from the model are normally distributed
which shows that the predictive power of this model is reliable.
Modelling the Test Dataset
## The following objects are masked from train (pos = 3):
##
## CGPA, Chance.of.Admit, GRE.Score, LOR, SOP, TOEFL.Score,
## University.Rating
## The following objects are masked from train (pos = 4):
##
## CGPA, Chance.of.Admit, GRE.Score, LOR, SOP, TOEFL.Score,
## University.Rating
## The following objects are masked from dat:
##
## CGPA, Chance.of.Admit, GRE.Score, LOR, Research, SOP, TOEFL.Score,
## University.Rating
##
## Call:
## lm(formula = Chance.of.Admit ~ GRE.Score + TOEFL.Score + CGPA +
## LOR, data = test)
##
## Residuals:
## Min 1Q Median 3Q Max
## -0.279714 -0.022678 0.009575 0.036309 0.160523
##
## Coefficients:
## Estimate Std. Error t value Pr(>|t|)
## (Intercept) -1.4630686 0.1057458 -13.836 < 2e-16 ***
## GRE.Score 0.0023179 0.0005761 4.023 6.88e-05 ***
## TOEFL.Score 0.0029252 0.0010761 2.718 0.00685 **
## CGPA 0.1228233 0.0118475 10.367 < 2e-16 ***
## LOR 0.0239713 0.0048405 4.952 1.09e-06 ***
## ---
## Signif. codes: 0 '***' 0.001 '**' 0.01 '*' 0.05 '.' 0.1 ' ' 1
##
## Residual standard error: 0.06443 on 395 degrees of freedom
## Multiple R-squared: 0.7979, Adjusted R-squared: 0.7959
## F-statistic: 389.9 on 4 and 395 DF, p-value: < 2.2e-16
Interpretation
With the result above, the coefficient of multiple determination has increased to 0.7979
which means that almost 80% of the variation in chance of admission can be explained by
the vraibles retained. Hence, the predictive power of the model has increased. Therefore,
the model is given as
** Chance of admission = -1.4630 + 0.00238 GRE.SCore + 0.002925 TOEFL score + 0.12282
CGPA + 0.02397 LOR **
This means that a student with higher CGPA followed by a higher LOR with moderate
results in either TOEFL or GRE has a bigger chance of getting admitted
Residual Analysis of the new dataset
## The following objects are masked from test (pos = 3):
##
## CGPA, Chance.of.Admit, GRE.Score, LOR, Research, SOP, TOEFL.Score,
## University.Rating
## The following objects are masked from train (pos = 4):
##
## CGPA, Chance.of.Admit, GRE.Score, LOR, SOP, TOEFL.Score,
## University.Rating
## The following objects are masked from train (pos = 5):
##
## CGPA, Chance.of.Admit, GRE.Score, LOR, SOP, TOEFL.Score,
## University.Rating
## The following objects are masked from dat:
##
## CGPA, Chance.of.Admit, GRE.Score, LOR, Research, SOP, TOEFL.Score,
## University.Rating
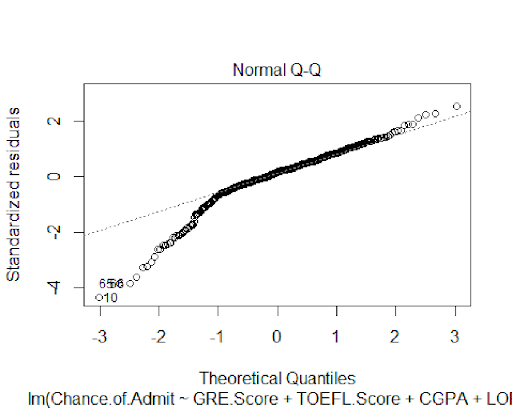
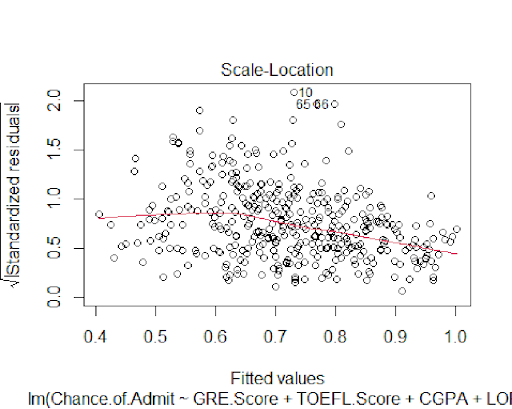
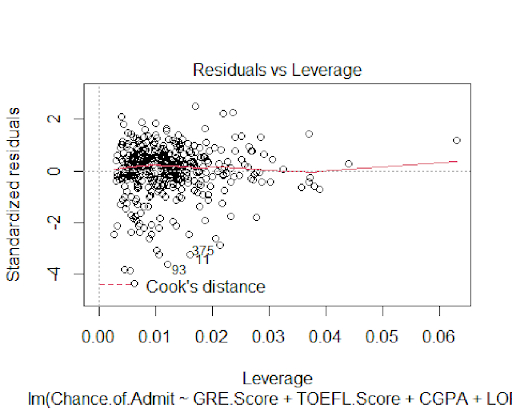
The plots also confirm the normality of the model's residuals.