Linus the Laureate and Nelly the Nutritionist
Linus Pauling is one of only four people ever to win two Nobel Prizes.' In 1970 Linus wrote a very popular book Vitamin C the Common Cold and the Flu, which claimed supplements of vitamin C can be taken to prevent getting the common cold. Largely due to Linus’s claims, Vitamin C supplements are now a growing 200 million dollar industry. However subsequent studies have shown that taking vitamin C does not prevent the common cold.'
Figure 1: Thumbnail for Vox video that inspired this question
Nelly is a nutritionist is that wants to investigate the effect of Vitamin C on mental health. Nelly suspects that modest amounts of vitamin C should improve people’s happiness. To test this belief, she makes weekly visits to a local nursing home for six months, talking with the residents for several hours each time and serving them rose hips tea, which has a lot of Vitamin C. After a few months the nursing home asks each of the people Nelly had tea with whether or not they have felt happier since Nelly started visiting. The 95*% of the people who responded said they have felt better since they started having weekly tea with Nelly.
(a) Is this a controlled experiment, an observational study, or neither? Explainbriefly.
(b) Identify the treatment and outcome (response) variables. Has the health food store owner established an association between the administering of vitamin C during her weekly visits and an improvement in health for the people in the nursing home?Explain briefly.
(c) Does this evidence prove that vitamin C was the cause of the residents' improvement, or could the improvement be due to a potential confounding factor (PCF)? If you believe the relationship causal, say why; if not, identify the PCF you have inmind.
Priscilla the Programmer
Nelly the nutritionist(from question one)was recently discussing her research on a zoom call with her sister Priscilla the Programmer.During their conversation, Priscilla mentions that she has seen a lot of online advertising for vitamin supplements since the outbreak of the COVID19 pandemic.Curious about whether or not the rest of the family has seen a similar amount of advertising, Priscilla creates a browser extension using computer vision algorithms to identify and tally vitamin supplemented- advertisements.Priscilla can convince 12 of her friends and family members to use the extension for a month.After a month Priscilla records the number of advertisements each person sees as shown below.
Volunteer Supplement Ads
| Alice | 43 |
| Bob | 37 |
| Carol | 30 |
| Dave | 11 |
| Eve | 41 |
| Frank | 41 |
| Gabby | 23 |
| Harry | 33 |
| Ida | 63 |
| Jack | 43 |
| Henrietta | 16 |
Table 1: Priscilla’s advertisement data.
Calculate the following summary statistics for Priscilla’s data. Remember to include your calculation procedure.
Calculate the following summary statistics for Priscilla’s data. Remember to include your calculation procedure.
(a) What is the mean number of advertisements received during the past month?
(b) What is the median number of advertisements received during the past month?
(c) Provide the range of thesample?
(d) What is the interquartile range of the sample?
(e) What is the standard deviation of the sample?
Spearman's Correlation Coefficient
After talking to some physicists' to better understand their data the researchers are not sure if the Pearson Correlation Coefficient is the most appropriate statistic to describe their data. The work-energy principle suggests that given perfect reaction time in a vacuum stopping distance should be quadratic 7 related to speed v, which in this case means that doubling the speed should result in approximately quadrupling the stopping distance.
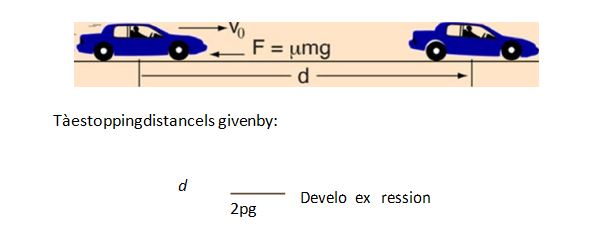
Figure 3: Stopping Distance Explanation from Georgia State University's hyper physics website
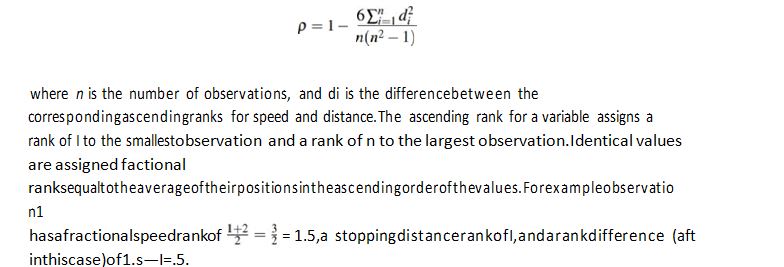
Keeping this in mind the stop time researchers decide to compute the Spearman Correlation Coefficient in addition to the Pearson Correlation coefficient (that we already computed in question 4). The equation for the Spearman Correlation Coefficient p is given below
(a) Finding the speed ranking (fractional if necessary)of every observation in the stopping time
data.
(b) Finding the stopping distance ranking(fractional if necessary)of every observation in the stop-
ping time data.
(c) Computed i for each observation in the dataset
(d) Use the above steps to compute the Spearman Correlation Coefficient p.
(e) The Spearman Correlation Coefficient p varies from — 1to1,
just like the Pearson Correlation Coefficient. Keeping this in mind briefly discuss your results in part d.
1.
- a) The example a controlled experiment due to the fact that a treatment was applied to the residents of the nursing home for a period of time.
- b) The treatment is the rose hips tea which contains vitamin C and the response is the mental health of the subjects (which in this case is their happiness).
The food store owner established an association between the administering of vitamin C during her weekly visit and an improvement in health for the people in the nursing home since 95% of the people who responded indicated that they felt happier since Nelly started visiting.
- c) This evidence does not totally prove that vitamin C was the cause of the resident’s improvement. There is the possibility of a potential confounding factor. This potential confounding factor can be the interaction of Nelly with the residents of the nursing home and not just the vitamin C. Residents of nursing homes might have been lonely and the several hours nelly spent with them might be the cause of the improvement of their mental health.
2.
Volunteer
Supplement Ad
Alice
43
Bob
37
Carol
30
Dave
11
Eve
41
Frank
41
Gabby
23
Harry
33
Ida
63
Jack
43
Henrietta
16
- Mean = (43+37+30+11+41+41+23+33+63+43+16)/11 = 34.6 ≈ 35
Arranging in ascending order
11, 16, 23, 30, 33, 37, 41, 41, 43, 43, 63
37 is the median.
Range = Highest value – Lowest Value
63 – 11 = 52
11, 16, 23, 30, 33, 37, 41, 41, 43, 43, 63
(11, 16, 23, 30, 33,)37, (41, 41, 43, 43, 63)
IQR = 43 – 23 = 20
Standard deviation =
- a) The population in the survey is the total number of people that purchased a custom closet in the past month. The sample is 1000 customers.
The population is larger than the sample.
- b) Simple random sampling
- c) There was no bias.
- d) Gender, date of birth, hometown and educational level are qualitative while age is quantitative.
Observation
Speed
Stopping Distance
1
4
2
2
4
10
3
7
4
4
7
22
5
8
16
6
9
10
7
10
18
8
10
26
9
10
34
10
11
17
11
11
28
12
12
14
13
12
20
14
12
24
15
12
28
16
13
26
- a) From the table above, it can be deduced that the correlation between speed and stopping distance is positive due to the fact that as the speed is increasing, the stopping distance also tends to increase.
- b) Speed and stopping distance are both quantitative variables.
c) Mean = (4+4+7+7+8+9+10+10+10+11+11+12+12+12+12+13)/16= 9.5
Median = 10
Mode = 12
Standard deviation = σ=√(1/N ∑_(i=1)^N▒〖(x_i-μ)〗^2 ) = 2.72
IQR = (4, 4, 7, 7, 8, 9, 10, 10,)(10, 11, 11, 12, 12, 12, 12, 13.)
= 12-7.5 = 4.5
d)
Mean = (∑▒x)/N = 18.7
Median = 19
Mode = 10, 26, 28
Standard deviation= σ=√(1/N ∑_(i=1)^N▒〖(x_i-μ)〗^2 ) = 8.8
(2,4,10,10,14,16,17,18,) (20,22,24,26,26,28,28,34)
IQR = 26 – 12 = 14
e) Correlation coefficient = r=(n(∑▒xy)-(∑▒x)(∑▒〖y)〗)/√([n∑▒x^2 -(∑▒x)^2][n∑▒y^2 -(∑▒y)^2])
r = 0.66
f) In this scenario, the correlation coefficient is expected to go up. The type of correlation specified is called Sample Correlation.
5. a)
Speed Rank
1.5
1.5
3.5
3.5
5
6
8
8
8
10.5
10.5
13.5
13.5
13.5
13.5
16
b)
Stopping Distance Rank
1
3.5
2
10
6
3.5
8
12.5
16
7
14.5
5
9
11
14.5
12.5
c)
di
0.5
2
1.5
6.5
1
2.5
0
4.5
8
3.5
4
8.5
4.5
2.5
1
3.5
d) =1- (6(56.4065))/(16(〖16〗^2-1)) = 0.9171
e) From the result in (d) above, the spearman rank correlation is 0.9171 which indicates that speed and stopping distance have a very strong positive correlation.