Assignment on Frequency distribution, Mean, Median, and Standard Deviation
Question 1 (2 points)
A doctor’s office staff studied the waiting times for patients who arrive at the office with a request for emergency service. The following data with waiting times in minutes were collected over one month
| 2 | 5 | 10 | 12 | 4 | 4 | 5 | 17 | 11 | 8 | 12 | 21 | 6 |
| 21 | 6 | 7 | 13 | 18 | ||||||||
| 3 |
Use classes of 0-4, 5-9, and so on the following:
a. Show the frequency distribution.
0-4 = 4
5-9 = 8
10 – 14 = 5
15 – 19 = 2
20 + = 1
b. Show the relative frequency distribution.
| Bin | Frequency | Rel frequency |
| 0-4 | 4 | 0.2 |
| 5-9 | 8 | 0.4 |
| 10-14 | 5 | 0.25 |
| 15-19 | 2 | 0.1 |
| 20+ | 1 | 0.05 |
| Total | 20 | 1 |
c. Show the cumulative frequency distribution.
| Bin | Frequency | Cumfrequency |
| 0-4 | 4 | 4 |
| 5-9 | 8 | 12 |
| 10-14 | 5 | 17 |
| 15-19 | 2 | 19 |
| 20+ | 1 | 20 |
| Total | 20 |
d. Show the cumulative relative frequency distribution.
| Bin | Frequency | Rel frequency | CumRelfrequency |
| 0-4 | 4 | 0.2 | 0.2 |
| 5-9 | 8 | 0.4 | 0.6 |
| 10-14 | 5 | 0.25 | 0.85 |
| 15-19 | 2 | 0.1 | 0.95 |
| 20+ | 1 | 0.05 | 1 |
| Total | 20 | 1 |
e. What proportion of the patients needing emergency service wait nine (9) minutes or less?
The cumulative relative frequency for 5-9 shows the patients needing emergency service wait nine (9) minutes or lessi.e 0.6. Thus, patients needing emergency service wait nine (9) minutes or less is 60%.
Question 2 5.2 Page 104 (1 Point)
27+31+33+35+40+64+65 = 295/7 = 42.142 (Mean)
Median = (n+1)/2 th value = 4th value
Which is 35 (Median)
The department should send the median age.
Question 3 5.4 Page 104 (1Point)
26+35+51+63+147= 322/5= 64.4 (Mean)
Median = (n+1)/2 th value = 3rd value
Which is 51 (Median)
The army should report the median.
Question 4 5.12 Pages 106 – 107 (2 Points)
a) The level of measurement are on ordinal scale.
b) The percentage distribution is as follows:
| Rating | Frequency | % |
| To a very great extent | 42 | 0.3784 |
| To a great extent | 31 | 0.2793 |
| To a moderate extent | 19 | 0.1712 |
| To some extent | 12 | 0.1081 |
| Not at all | 7 | 0.0631 |
| Total | 111 | 1 |
Question 5 5.14 Page 108 (2 Points)
| Rating | Frequency | % |
| Far above expectations | 15 | 0.1145 |
| Above expectations | 22 | 0.1679 |
| Meets expectations | 77 | 0.5878 |
| Below expectations | 9 | 0.0687 |
| Below expectations | 8 | 0.0611 |
| Total | 131 | 1 |
Measures of central tendency:
Median = (n+1)/2 th value = 66th value
The 66th value is “meets expectations” and is the median.
c) Since about 50% of the employees have rated “meets expectations”, “below expectations” or “far below expectations”. Thus, the feeling of the head of the Department that at least 90% of them fall into the top two categories is not correct.
Question 6 6.2 Page 118 (1 point)
Median: Since n is even, the formula for the median is:
Average of n/2 th value and (n/2)+th value
Since n=14, median is average of 7th and 8th value
Arranging the data in ascending order,
7th value is 7
And 8th value is 8
Thus, the median is an average of 7 and 8 which is 7.5
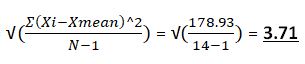
Mean = Σxi/ n = 99/14 = 7.07
| Xi | Xi-Xmean | (Xi-Xmean)^2 |
| 0 | -7.07 | 49.9849 |
| 3 | -4.07 | j |
| 3 | -4.07 | 16.5649 |
| 4 | -3.07 | 9.4249 |
| 5 | -2.07 | 4.2849 |
| 6 | -1.07 | 1.1449 |
| 7 | -0.07 | 0.0049 |
| 8 | 0.93 | 0.8649 |
| 9 | 1.93 | 3.7249 |
| 9 | 1.93 | 3.7249 |
| 10 | 2.93 | 8.5849 |
| 11 | 3.93 | 15.4449 |
| 12 | 1.93 | 24.3049 |
| 12 | 4.93 | 24.3049 |
| Σ=99 | Σ=178.9286 |
Standard deviation =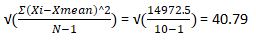
| Xi | Xi-Xmean | (Xi-Xmean)^2 |
| 75 | 15.5 | 240.25 |
| 20 | -39.5 | 1560.25 |
| 15 | -44.5 | 1980.25 |
| 95 | 35.5 | 1260.25 |
| 30 | -29.5 | 870.25 |
| 100 | 40.5 | 1640.25 |
| 40 | -19.5 | 380.25 |
| 10 | --49.5 | 2450.25 |
| 90 | 30.5 | 930.25 |
| 120 | 60.5 | 3660.25 |
| 595 | 0 | 14972.5 |
Range = Maximum-Minimum = 120-10 = 110