Performing correlation analysis using SAS
The explanation and screenshots below explain the relationship between prices and the quality of products. The screenshots are derived from SAS.
Task
- State your Business question. State your alternate and null hypotheses. (When you have a business problem, you can create a business question. The answer to the business question should solve the business problem. There are 2 hypotheses for each business question: alternate hypotheses and null hypotheses).
- Screenshots of the imported dataset. Screenshots must include the date and time of the screen capture.
- Screenshot of the loaded dataset. Screenshots must include the date and time of the screen capture.
- Descriptive statistics to include charts, graphs, tables, business insights, and the story the data is telling us.
- Screenshots of the whole work and steps that were done within the SAS studio, in order to show the steps that were executed and completed. Screenshots should include the date and time of the screen capture. Please find attached the "Examples of SAS Screenshots". Limit the charts, graphs, and tables in your analysis report to only those figures needed to support your findings and analysis. Do not include statistics outputs that are not relevant to your analysis. Your analysis report should be comprehensive yet concise, specific, and most importantly, insightful. The overall paper, including the screenshots, should be about 6 pages in length minimum and must have 2 scholarly sources at least. The paper can include 1 paper about the analysis, stating an Introduction, the business question, the alternate and null hypotheses, and a conclusion. The last 5 pages could be all of the SAS screenshots of the work done. Figure notation for screenshots should comply with APA citation format guidelines.
Introduction
Economic theory has long predicted a negative relationship between price and quantity demanded normal goods and a positive relationship between price and quantity demanded an ostentatious good. A common marketing strategy is the price discount where consumers are given some percent off when they buy up to a given amount. It is a means of encouraging and motivating the consumers to buy more of a product (Yin and Huang, 2014). The price-quality-value model of Monroe and Krishnan (1985) and the means-end model of Ziethaml (1988) suggests that consumers perceived highly-priced product as having high quality and a product with high discount are perceived as a low-quality product (Lee and Chen-Yu, 2018). Moreover, lower prices and high discounts increase the purchasing power of the consumers and it may encourage them to buy more of the product. Thus, this study will investigate the effect of price and discount on the quantity purchased for Northwind’s product.
Business Question
The business questions which this study seeks to provide answers is:
- Is there a significant effect of price on quantity demanded?
- Is there a significant effect of discount on quantity demanded?
Hypothesis
Based on the business questions, the following hypothesis is formulated
H01: there is no significant effect of price on quantity demanded
Ha1: there is a significant effect of price on quantity demanded
H01: there is no significant effect of quantity on quantity demanded
Ha1: there is a significant effect of quantity on quantity demanded
Results and Conclusion
It is often recommended to start the analysis of business questions with descriptive statistics to gain quick insight into the possible relationship between variables. Descriptive statistics may be presented in graphical form or summary statistics. Since we have a continuous variable, we may first view the distribution of the variables like this will give us an indication of whether the distribution is skewed or we have some extreme values that we could pay more attention to in order to know if there is a something special about them. We are considering three variables: quantity, price, and discount. Their histogram is presented in figure 3. The result shows that while quantity is fairly normally distributed, unit price and discount are not. Figure 4 presents the summary statistics for the variables. The result shows that the average quantity ordered is approximately 24 units. The lowest unit sold is 1 unit while the highest is 70 units. The average price is $20.01. The cheapest product cost $2.00 while the dearest product cost $99.00. The average discount given is 5.93%. No discount was given for some orders while the highest discount given is 25%.
Fig 5 presents the scatterplot of quantity against price and quantity against discount. The scatterplot provides a quick insight into the possible relationship between the dependent variable on the y-axis and the independent variable on the x-axis. The line of best fit was plotted on the scatter graph to make the direction more visible on the graph. The result suggests there is no significant relationship between price and quantity as the regression line is almost horizontal. Conversely, the plot suggests a positive relationship between price and discount as the regression line has a positive slope.
The correlation between quantity, price, and discount are presented in fig 6. The result shows there is a weak positive correlation between quantity and price while there is a medium positive correlation between quantity and discount. The regression result to measure the magnitude of the effect of price and discount on quantity is presented in table 7. The result shows that unit price has a positive but insignificant effect on quantity (p=0.25) which means there is no significant relationship between price and quantity. Therefore, we could not reject the null hypothesis ‘H01’. On the other hand, the discount has a positive significant effect on quantity (p<.001) which means there is a significant positive relationship between price and quantity. Therefore, we reject the null hypothesis ‘H02’. The result proves that the higher the price, the higher the quantity purchased. The estimated beta value of 65.99 shows that a 1% increase in discount will lead to an approximately 66 unit increase in quantity purchased. The adjusted R2 shows that price and discount explain 13.91% of the variation in quantity and the F test shows that the model is statistically significant (p<.001).
In conclusion, the result shows that discount matters for sale than quantity, and the company could increase its sales further by giving more discounts to encourage consumers to buy more.
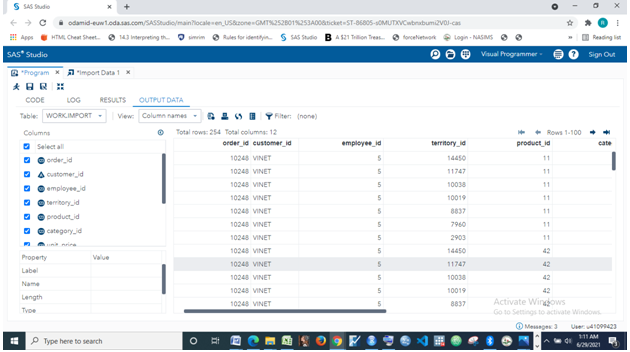
Fig 1: Imported dataset
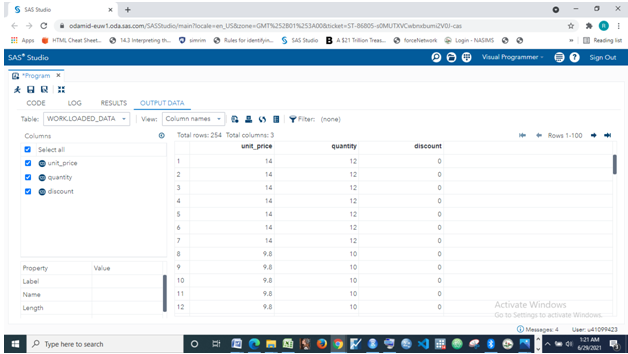
Fig 2: Loaded Dataset
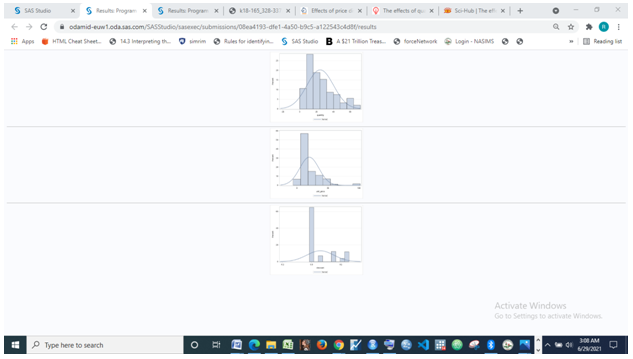
Fig 3: Histogram Showing distribution of Variables
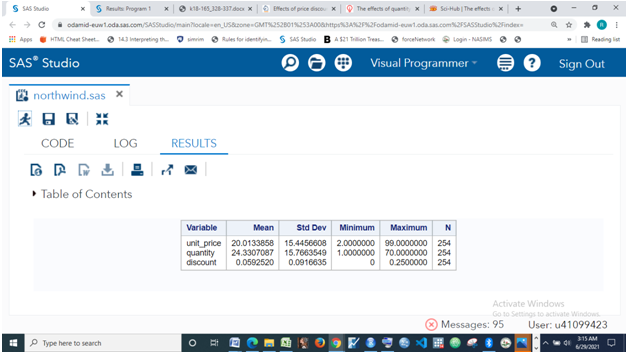
Fig 4: Summary Statistics
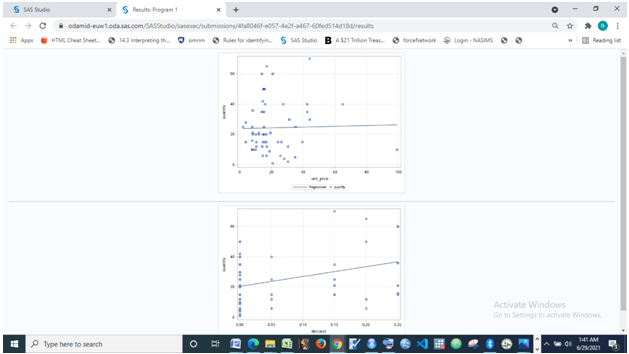
Fig 5: Scatter Plot
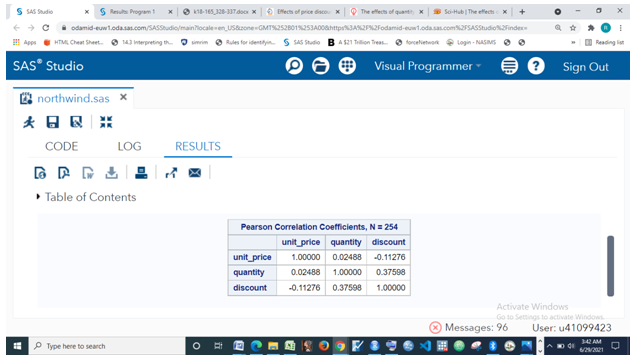
Fig 6: Correlation Matrix
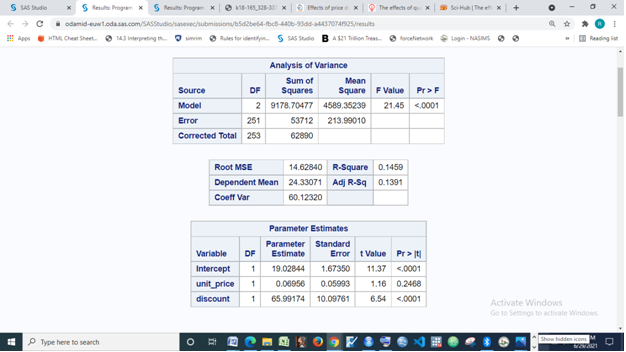
Fig 7: Regression Result