Assignment Instructions
BSTAT 3321 Projects Spring 2021
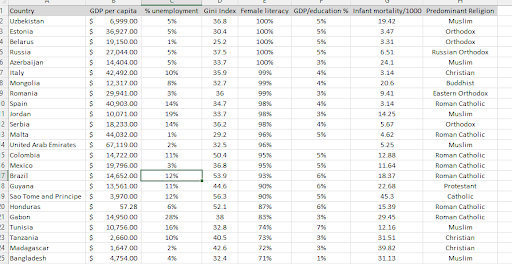
The purpose of this project is to describe a random sample of 30 countries and infer to all of the countries in the world some characteristics. The following variables will be considered.
Economy
a. GDP per capita in dollars (PPP)
b. Unemployment as a percent
c. Gini index
People and Society
d. Female literacy rate as a percent (will be missing from first world countries, use 99)
e. GDP spent on education as a percent
f. Infant mortality rate as total deaths per 1000 live births
g. Predominant religion as one name e.g., Protestant Christianity for the United States
The project will be submitted as an Excel workbook for data and parts 1-4 and a Word or pdf file for part 5. Put the data on Sheet 1 and 1a on Sheet 2, 1b on Sheet 3, …, 2 on Sheet 7 , 3 on Sheet 8, 4a on Sheet 9, 4b,c,&d on Sheet 10,4e on Sheet 11.
1. For the countries in your sample, use Excel to construct the following graphs
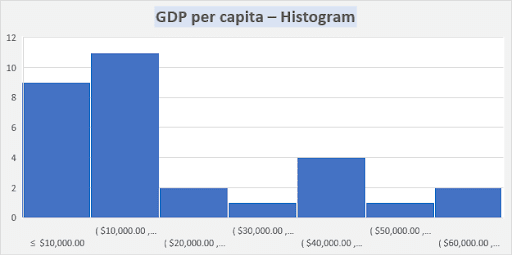
a. GDP per capita – histogram (4 points) Sheet 2
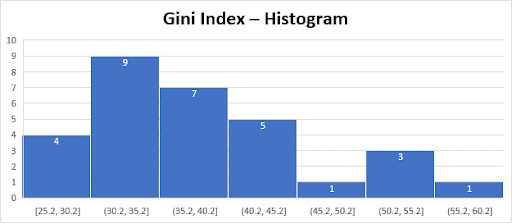
b. Gini index –histogram (4 points) Sheet 3
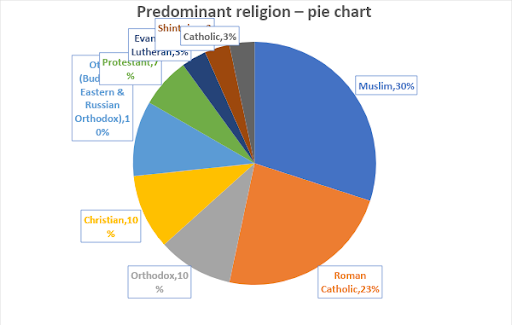
c. Predominant religion – pie chart (max of 9 slices) (4 points) Sheet 4
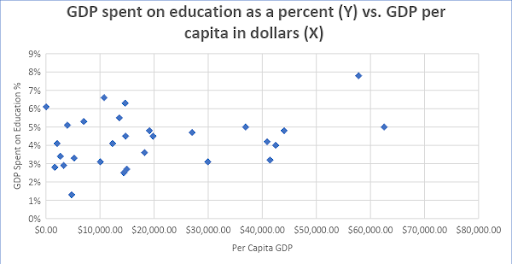
d. GDP spent on education as a percent (Y) vs. GDP per capita in dollars (X) – scatterplot (4 points) Sheet 5
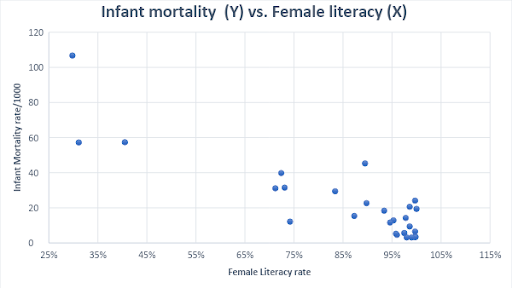
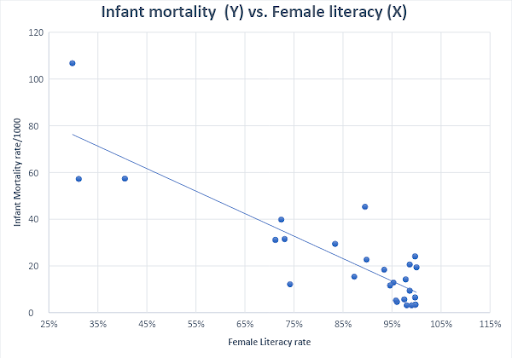
e. Infant mortality (Y) vs. Female literacy (X) – scatterplot (4 points) Sheet 6
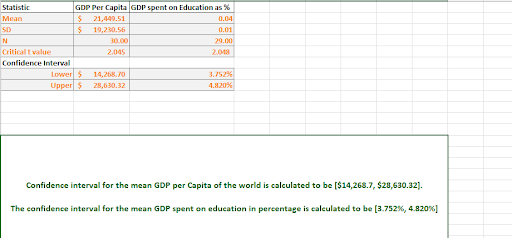
2. Construct a 95% confidence interval for the world’s mean GDP per capita and mean GDP spent on education as a percent. (10 points each) Sheet 7
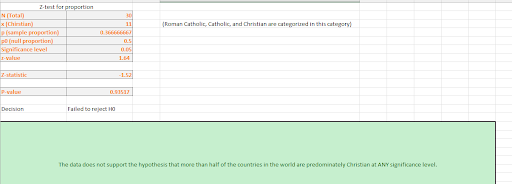
3. Do your data support the hypothesis that more than half of the countries in the world are predominately Christian at the .05 significance level? At the .10 level? (20 points) Sheet 8
4. Regression and Correlation analysis
a. Determine the sample regression line relating infant mortality to female literacy and plot it on a new scattergram. (4 points) Sheet 9
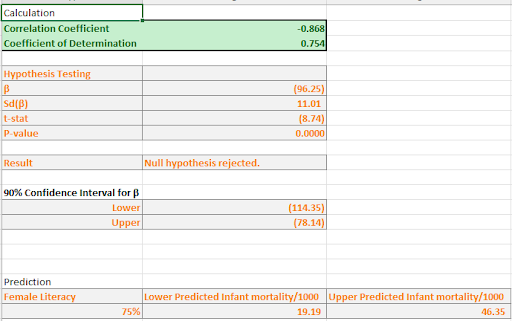
b. Compute the correlation coefficient and coefficient of determination. (4 points) Sheet 10
c. Test the hypothesis that 1 = 0. (4 points) Sheet 10
d. Compute a 90% confidence interval estimate for 1. (4 points) Sheet 10
e. With 90% confidence, estimate an average for all countries and predict for an individual country the infant mortality rate when the female literacy rate is .75. (4 points) Sheet 11
5. Interpret in detail the specific results of the above analysis (parts 1, 2, 3, and 4) in a managerial summary of no more than one page using non-technical language, meaningful to a person who doesn’t know statistics. (20 points)
Bonus: Appearance: table of contents, paging, clarity, color, illustrations (10 points)
Assignment Solution
Managerial Summary
The analysis of world countries data reveals some interesting insights. The data in this work consisted of a random sample of 30 countries with attributes: GDP per capita, Unemployment as percentage, Gini Index, Female Literacy rate as percentage, GDP spent on education as percentage, Infant mortality rates per 1000, and predominant religion. This analysis, however, focuses more on the relationship between the female literacy rate and the infant mortality rates, but some other variables were also analysed on basic levels.
The GDP per capita variable in the sample shows that the majority of countries (~67%) have per capita GDP in the range of <$20,000. The highest bracket for per capita GDP was $60K-$70K in the sample with 2 observations. This is an example of right skewed data where most of the mass is concentrated on the left of the distribution, with some large outliers. The Gini Index variable shows a peak around 30-35 range with as much as 30% of observation in that interval. Predominant religion variable shows that the most frequent religion is Muslim (around ~30%) but if different branches of Christians is considered, the proportion is highest in the sample with around ~36% but it is nowhere near close to more than 50%; a claim which was tested and rejected on the basis of statistical evidence.
On looking at the relationship between % of GDP spent on Education vs GDP per capita, no strong observable pattern was observed. This was a counter intuitive finding as some relationship was expected here. The average GDP per capita and average percentage of GDP spent on education was estimated to be in interval of [$14,268.7, $28,630.32], and [3.752%, 4.820%] respectively for 95% confidence which means one can be 95% confidence that average per capita GDP and average percentage of GDP spent on education lies in these intervals, respectively.
After this, the relationship between Infant mortality rate and female literacy rate was explored and here, a very strong negative relationship was observed. The higher the female literacy was, smaller the infant mortality rate was observed. This was also tested and verified statistically, and overwhelming evidence was found in the favour of this claim in the sample. This analysis may indicate causal relationship, although it does not guarantee causality. The relationship was estimated as: Infant mortality (Y)= 104.96 - 96.25× Female literacy (X)through the statistical analysis. The above equation gives a way to predict the Infant mortality given Female Literacy. The precision of this prediction is expected to be quite well as this model was able to explain 75.4% of the variance in infant mortality based on female literacy alone which is quite staggering. On further analysis, it was confirmed that the relationship between the two variables were significant and it opens the scope for further studies.