Problem Description:
The aim is to explore and compare the physical characteristics of individuals from two different ancient cultures, Jomon and Yayoi, with a focus on Bone Femur Length (BFL). We examine summary statistics, visualize the data using box plots, and analyze Z-scores to draw conclusions about the similarities and differences in BFL between the two cultures and across genders.
Solution
Table 1: Summary statistics
Descriptive Statistics
| Culture | Sex | N | Minimum | Maximum | Mean | Median | Mode | Range | Std. Deviation | ||||
|---|---|---|---|---|---|---|---|---|---|---|---|---|---|
| Jomon | 1 | BFL | 29 | 38 | 45 | 41.28 | 41.50 | 39 | 7 | 1.753 | |||
| 2 | BFL | 14 | 36 | 44 | 38.48 | 37.90 | 36 | 8 | 2.355 | ||||
| Yayoi | 1 | BFL | 23 | 35 | 47 | 42.44 | 42.80 | 42 | 12 | 2.893 | |||
| 2 | BFL | 20 | 36 | 44 | 39.72 | 39.65 | 36 | 8 | 2.391 | ||||
From Table 1, it is very clear that the central tendencies (Mean, Median and Mode) and dispersions (Range and Standard deviation) of BFL for Jomon male is not similar to that of Jomon female. Similarly, the statistics are not similar for Yayoi male and Yayoi female. However, Jomon male and Yayoi male have similar central tendencies and dispersions of BFL likewise Jomon female and Yayoi female as evident in the table.
Box plot
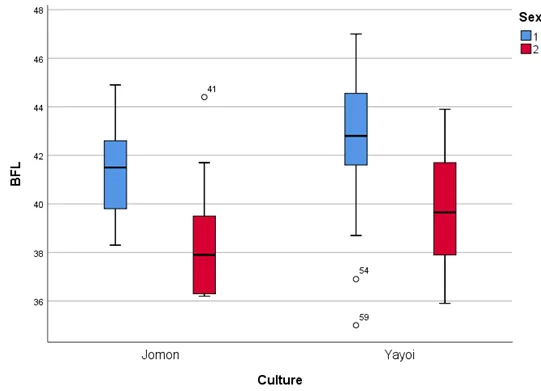
Figure 1: Box plot by Sex by Culture
Figure 1 contains box plots of BFL categorized by sex and culture. Since both sex and culture have two categories each, four box plots are been produced which are meant for Jomon male, Jomon female, Yayoi male and Yayoi female as displayed in the above figure.
Except for Yayoi (sex=2), the remaining three box plots exhibit non-normality as a result of unequal box and whiskers lengths. The interquartile ranges (Q3-Q1) which is the length of the box do not overlap for Jomon males and Jomon females since the boxes for Jomon males is completely above that of Jomon females. Similarly, the boxes do not overlap for Yayoi males and Yayoi females since the box for Yayoi males is completely above that of Yayoi females.
The medians for Jomon males and Jomon females do not overlap because the median line of Jomon male lie outside of Jomon female box. Also, the medians for Yayoi males and Yayoi females do not overlap because the median line of Yayoi male lie outside of Yayoi female box.
We can support the hypothesis that one group had larger femora based on these observations or that one group was more or less variable since we have non-overlapping boxes and the medians do not overlap with the boxes.
Distribution of Z scores
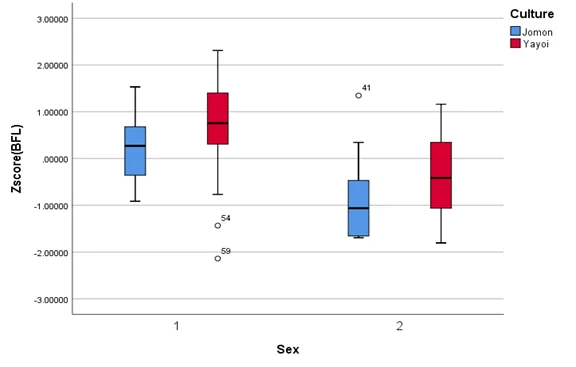
Figure 2: Box plot of Z-scores by Culture by sex
Figure 2 contains box plots of Z scores BFL. The plots reveal that the boxes of Jomon and Yayoi males do overlap. Also, the boxes of Jomon and Yayoi females overlap as displayed in the figure. The boxes do not spread beyond the medians. This implies that BFL in Jomon and Yayoi groups are likely to be the same.