Problem Statement
The task is to implement and compare two different estimators for the population standard deviation of loan amounts in a subprime dataset. The two estimators are the traditional unbiased estimator and a maximum likelihood (ML) estimator. Your objective is to analyze their performance through simulations and evaluate their bias, variance, and mean squared error.
Solution
Write a function in R which implements the ML estimator.
We use the given formula below to implement the ML estimator:
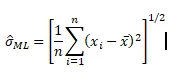
## Function for alternate estimator of standard deviation
sd.alt = function(x)
{
ans = sd(x)*sqrt((length(x)-1)/length(x))
return(ans)
}
Applying this to first 100 samples of loan.amount
# ML-estimator to the first 100 samples of loan.amount:
sd.alt(subprime$loan.amount[1:100])
## [1] 72.57143
Comparison of the estimators using simulation
set.seed(111)
S = c() #initalizing a null vector for S
Salt = c() #initalizing a null vector for Sd.alt
set.seed(111)
for (i in 1:5000) {
X = sample(subprime$loan.amount,15, TRUE)
S = c(S,sd(X))
Salt = c(Salt,sd.alt(X))
}
The average estimate of the population standard deviation (for S and Salt)
cat("\n Average estimates of the usual estimator: ",
mean(S))
##
## Average estimates of the usual estimator: 156.0439
cat("\n Average estimates of the alternate estimator: ",
mean(Salt))
##
## Average estimates of the alternate estimator: 150.7527
The difference between the average estimate of the population standard deviation and the true population standard deviation.
cat("\n Bias estimates of the usual estimator: ",
mean(S)-sd(subprime$loan.amount))
##
## Bias estimates of the usual estimator: -14.81847
cat("\n Bias estimates of the alternate estimator: ",
mean(Salt)-sd(subprime$loan.amount))
##
## Bias estimates of the alternate estimator: -20.10964
The variance of your estimates (for S and Salt)
cat("\n Variance estimates of the unbiased estimator: ",
var(S))
##
## Variance estimates of the unbiased estimator: 4755.056
cat("\n Variance estimates of the ML estimator: ",
var(Salt))
##
## Variance estimates of the ML estimator: 4438.052
What do you notice about the bias and variance of each of the estimators? What about the MeanSquared Error?
We collect these metrics (bias, variance and MeanSquaredError) for the both estimators in one table to make the comparison easier:
For the mean squared error we use the following formula:

comp_estimator=data.frame(estimator=c("Unbiased Estimator", "ML Estimator"))
comp_estimator$bias=c(mean(S)-sd(subprime$loan.amount), mean(Salt)-sd(subprime$loan.amount))
comp_estimator$var=c(var(S), var(Salt))
comp_estimator$mse=c(var(S)+(mean(S)-sd(subprime$loan.amount))^2,
var(Salt)+(mean(Salt)-sd(subprime$loan.amount))^2)
comp_estimator
## estimator bias var mse
## 1 Unbiased Estimator -14.81847 4755.056 4974.643
## 2 ML Estimator -20.10964 4438.052 4842.450
Bias is more for alternative estimator while variance is more for the usual estimator The MSE is higher for usual estimator.