Problem Description:
The aim of this statistical analysis homework is to analyze data to understand the differences in optimism scores between females and males. We uncovered key insights into the distribution of optimism scores and any significant variations between the two genders:
Solution
Descriptive Statistics Analysis
- Females have an average optimism score of 20.6, median optimism score of 21, and the optimism score that appears most frequently is 21. Standard deviation is 2.92, kurtosis is 2.23, and skewness is -1.23. The minimum optimism score recorded among females is 13 and 24 is the highest. Males have an average optimism score of 20.5, median optimism score of 19, and the optimism score that appears most frequently is 17. Standard deviation is 4.90, kurtosis is -0.55, and skewness is 0.86. The minimum optimism score recorded among males is 15 and 30 is the highest.
- For females, the minimum value is 13 and the maximum value is 24 giving a range of 11 this show some variation. This is buttressed by a standard deviation value of 2.92. On the other hand, the minimum value obtained for Males is 15 and the maximum value is 30 giving a range value of 15 this show more variability than observed in females. Hence a standard deviation of 4.90 is in sync.
Also, for the females' data, the mean, 20.60, is less than the median (21), indicating that the distribution is skewed negatively. A skewness value of -1.23 buttresses this observation as well. This negative skewness means only a few females score low on optimism while more females have more optimistic outlook towards the future. For the males' data, the mean 20.5 is higher than the median which is 19, indicating that the distribution is positively skewed. A skewness value of 0.86 buttresses this. The positive skewness means only a few score high in optimism among males while having a low optimistic score is the commoner occurrence among males.
-
The data for women, as stated above, is negativity skewed. The raw data have most the results falling within 17 and 24. However there is just one entry that recorded 13, this is an outlier and it is the value responsible for the negative skewness. To have a normal distribution, we could possibly remove that single '13' entry. We can also replace it (the 13) with the mean of the mode or median (21) of the distribution.
The data for men is also skewed, howbeit positively. Of the 15 entries, 12 of them range between 15 and 24, three people scored 30, 28 and 28. Those are the outliers that stretched the distribution positively. To yield a normal distribution, we could replace the three outliers with the median of the distribution (19)
- Include the frequency polygon for females and males in the Results section.
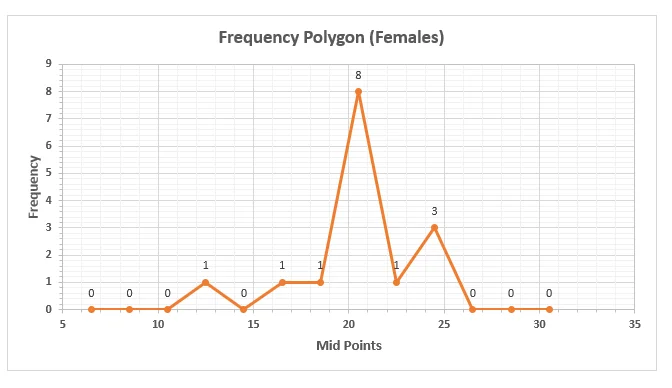
Figure 1: Frequency Polygon Female
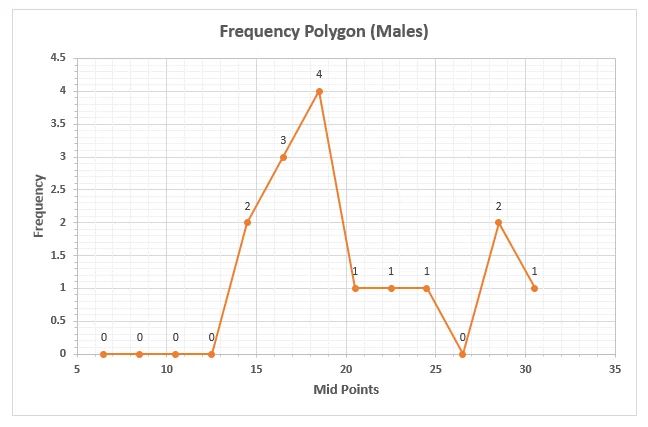
Figure 2: Frequency Polygon Male
Independent Samples T-test Analysis
- Null hypothesis: there is no statistically significant difference between the mean levels of optimism of females compared to that of males.
- The p-value of the independent t-test is 0.964282
- Compared to alpha value of 0.05, the p-value of the distribution is greater than alpha (p-value>0.05), hence we fail to reject the null hypothesis.
- That we fail to reject the null hypothesis means that the difference observed between the mean optimism score of males and that of females is not statistically significant.
Discussion
The finding of this survey show that women, on an average, have a more optimistic outlook towards life and the future than men. While few women score low in the survey, the contrast is the case for men, with only few of them scoring high. This is in sync with the findings of the non-scholarly article, 'Girlfriends are key to women's optimism'. Although this survey did not explore possible factors responsible for this like the article did where they found out that one major contributing factor to this observation is the close ladies circle that provide social support for them, a structure which men do not have. This is further buttressed by the peaked-ness observed in the frequency polygon. The peaked-ness is observed at a mid-point score of 20.5 for females while it is observed at a mid-point score of 18.5 for males.
However on subjecting the observed difference in mean between the two groups to statistical testing, using the independent t-test, the difference observed in mean was found not to be statistically significant. Which means the difference observed cannot be safe extrapolated to the general population. Increasing the population of this survey however may be helpful here, as it may yield a statistically significant difference with a large sample size.