Problem Description:
This inferential statistics homework focuses on the testing of proportions and means to make inferences about populations. Two key questions are addressed in this homework: (1) Is the proportion of schools with Grade B different from 50%? (2) Is the population mean of reading scores greater than 500?
Solution:
Test of Proportion and Mean
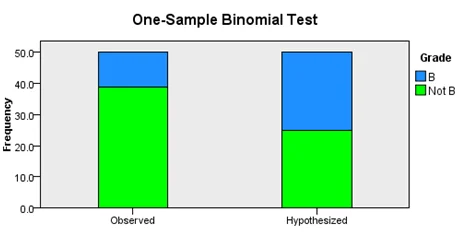
1. The 95% confidence interval of proportion for Grade B was obtained to test the following hypothesis
Null Hypothesis: The probability that a school will have a Grade B is 0.5 (p = 0.5)
Alternative Hypothesis: The probability that a school will have a Grade B is not equal to 0.5
The confidence interval was obtained in SPSS and the result is displayed below;
| Confidence Interval Type |
Parameter | Estimate | 95% Confidence Interval | |
|---|---|---|---|---|
| Lower | Upper | |||
| One Sample Binomial Success rate(Clopper-Pearson) |
Probability (Grade = B) |
.220 | .115 | .360 |
The result indicates that the proportion of all schools with grade B can be as low as 11.5% and can be as high as 36%.
2. To test whether the true proportion of schools with grade B is less than 0.5, a test of proportion was carried out in SPSS with the following hypothesis and rejection rule
Null Hypothesis: The probability that a school will have a Grade B is 0.5 (p = 0.5)
Alternative Hypothesis: The probability that a school will have Grade B is less than 0.5 (p<0.5)
Rejection rule: We reject the null hypothesis if the p-value is less than 0.05
The test result has a p-value less than 0.05, we reject the null hypothesis and conclude that, the probability that a school has a grade B is less than 0.05.
| Total N | 50 |
| Test Statistics | 11.000 |
| Standard Error | 3.536 |
| Standardized Test Statistics | -3.818 |
| Asymptotic Sig. (2-sided test) | .000 |
3. The confidence interval for the population mean is given in the table below
Descriptives
| Descriptives |
||||
|---|---|---|---|---|
| |
Statistic |
Std. Error |
||
| Math Score |
Mean |
537.82 |
6.758 |
|
| 95% Confidence Interval for Mean |
Lower Bound |
524.25 |
|
|
| Upper Bound |
551.40 |
|
||
| 5% Trimmed Mean |
538.36 |
|
||
| Median |
525.00 |
|
||
| Variance |
2329.228 |
|
||
| Std. Deviation |
48.262 |
|
||
| Minimum |
438 |
|
||
| Maximum |
620 |
|
||
| Range |
182 |
|
||
| Interquartile Range |
83 |
|
||
| Skewness |
.115 |
.333 |
||
| Kurtosis |
-1.012 |
.656 |
||
The 95% confidence interval of the population mean (524.25, 551.40) indicates that we 95% confident that the population average math score is between 524.25 and 551.40
4. To test whether the true population mean of reading score is greater than 500, the following hypothesis was tested at 0.05 level of significant
Null hypothesis: The population mean reading score is 500
Alternative hypothesis: The population mean reading score is less than 500
Rejection rule: Reject the null hypothesis if the p-value is less than 0.05
The test result is displayed below;
| One-Sample Statistics |
||||
|---|---|---|---|---|
| |
N |
Mean |
Std. Deviation |
Std. Error Mean |
| Reading Score |
51 |
534.67 |
47.903 |
6.708 |
| One-Sample Statistics |
||||
|---|---|---|---|---|
| |
N |
Mean |
Std. Deviation |
Std. Error Mean |
| Reading Score |
51 |
534.67 |
47.903 |
6.708 |
The test result has a p-value greater than 0.05, the null hypothesis is not rejected and hence we conclude that the population mean reading score is 500. [t (50) = 5.168, p>0.05]