Running T-test using SPSS
Here, an independent t-test was conducted using SPSS to compare the family income vs. hours worked in a week between participants seeking to have more or fewer kids.
Task
Open the GSS 2016 SPSS file and run T-test and ANOVA test.
Variables for each test are listed below.
Run both tests and interpret and report the results- following the APA reporting format
T-test variables
Independent: 18- ABNOMORE
Dependent: 140- CONINC – family income
302 HRS1- hours worked last week
ANOVA test variables
Independent:281- HHRACE
Dependent: 140- CONINC – family income
302 HRS1- hours worked last week
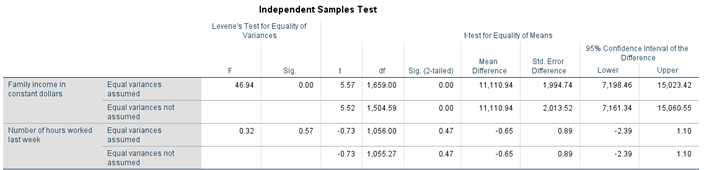
An independent t-test was conducted to compare the family income, and hours worked last week between the married participants wanting any more children or not. Based on independent sample t-test results, two groups were significantly different in terms of Family Income (t = 5.57, p < .01)with group wanting more child (M = 54,129.43, SD = 45.570.36)were having higher income than group not wanting more child(M = 43,018.49, SD = 35,417.15). Groups were found to be not significantly different in terms of numbers of hours last week (t = -.73, p=.47) where the group wanting more children (M = 41.50, SD = 14.57) was roughly working the same hours last week than the group not wanting more child (M = 42.14, SD = 14.30).
Running ANOVA to compare family income
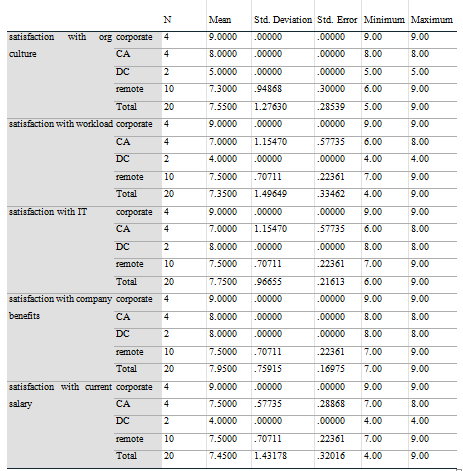
In this solution, we are going to compare the results of working hours among different races and the income earned within that period.
One-way ANOVA was used to compare the family income, and hours worked last week among the races. The mean family income for group 1 (White) was M=51304.25 and mean working hours last week was M = 41.07, group 2 (Black) was M=31,565.81 and mean working hours last week was M = 39.40, group 3 (Amer Indian) was M=20,924.36 and mean working hours last week was M = 37.25, group 4 (Asiatic, oriental) was M=74,512.85 and mean working hours last week was M = 42.03, and group 5 (Other, Mixed) was M=45,886.03 and mean working hours last week was M = 42.15. One way ANOVA results yielded statistically significant results for the differences in average family income, F (4,2580) = 28.637, p<.001, but insignificant for the average number of hours worked last week, F(4,1636) = 1.237, p = .293.
Post hoc tests for differences between family income revealed that the differences between group 1 and 2, group 1 and 3, group 1 and 4, group 2 and 4, group 2 and 5, group 3 and 4, and group 4 and 5 are statistically significant, p<0.05. Post hoc tests for the difference between the average number of hours worked last week were not performed as the null hypothesis was not rejected.