Statistical Tests and Data Interpretation.
Here, various types of hypothesis tests like ANOVA, Implicit Bias Test, and T-tests are conducted. In some questions, we identified the most suitable type of test needed for the described situation and in others, calculations are made to decide on the right hypothesis.
Finding k, N, and n
A research lab is using the Implicit Bias Test in order to study inclusion disparities in their hospitals and how it may relate to patient feedback to clinical care. Based on the following description in APA format, state the value for k, N, and n:
A one-way analysis of variance showed that the most positive feedback to clinical care was led by clinicians with little or no automatic preference in terms of race, gender, and sexual orientations F(4,30)=7.86, p<0.01.
Solution
Answer 1:
k=df1+1 = 4+1 =5
df2= N-k=30
N-5 = 30
N=35
N=kn => n=N/k = 35/5=7
Data Interpretation and Identification of Appropriate Tests
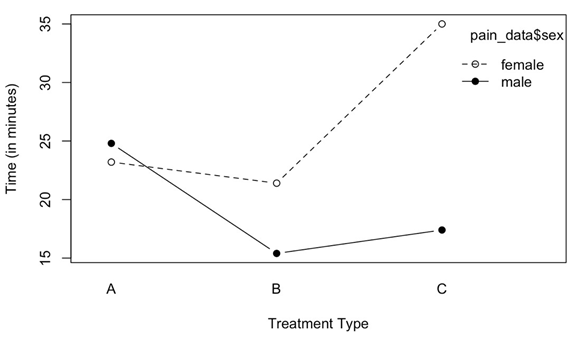
Use the graph below to answer the items that follow:
Solutions:
a) Is the remaining effect of Sex? Explain
The mean for time-based for females seems to be higher than meantime for male participants and thus, there seems to be a difference based on sex.
b) Is the remaining effect of Treatment? Explain.
The average of treatment C seems to be higher than the average time for treatments A and B and there seems to be the main effect of treatment.
c) Is there an interaction between Sex and Treatment? Explain.
There is a large difference in treatment C for the meantime in male and female participants and this difference is comparatively smaller for treatment B and least for treatment A. Thus, there is an interaction between sex and treatment.
Finding the Right Hypothesis Test.
For each of the following state the appropriate hypothesis test and justify why you selected that test. NOTE: this means ANY hypothesis test covered this semester: z-test, one-sample t-test, independent sample t-test, dependent measures t-test, one way-ANOVA, two-way ANOVA, correlation(specify which type), and regression
a). An industrial psychologist creates a questionnaire to measure social satisfaction among married, single, and divorced employees to determine whether social satisfaction can influence job performance.
Since both social satisfaction and job performance are quantitative variables and the statement clearly defines the dependent and independent variables, regression analysis will be used.
b). A statistics professor wants to know if there is a relationship between the time spent in tutoring sessions and exam scores.
Since both time spent and exam, scores are quantitative variables but the statement does not clearly define the dependent and independent variable, correlation (Pearson’s) will be used.
c). An abnormal psychology professor administered a survey her students needed to take before the semester began and again after the semester ended to determine any significant changes in knowledge about the class.
Since the students used are the same i.e. knowledge is judged before and after the semester and the comparison of knowledge is based on before and after the semester, the paired t-test is used.
d). A political science professor measures the relationship between political affiliation(Republican, Democratic) and satisfaction towards presidential leadership (using a rating scale).
Since the dependent variable “satisfaction towards presidential leadership” is considered a quantitative variable (a rating scale, ordinal) and the independent variable “political affiliation” is a dichotomous variable, independent samples t-test will be used.
e). A researcher wants to determine if social media activity (posting, no posting) has a significant impact on anxiety levels (anxious, not anxious).
A Chi-square test will be used since both the variables are dichotomous variables.
f). A nutrition professor randomly assigned her class into two different groups to see if they performed significantly differently in terms of fitness level scores for the final project.
Since the dependent variable “fitness level score” is a quantitative variable and the independent variable “two groups” is a dichotomous variable, independent samples t-test will be used.
A study was conducted to measure the relationship between caffeine intake (milligrams) and reaction time (seconds). A psychologist wanted to determine whether the amount of caffeine(small dose, medium dose, large dose) intake would impact reaction time in a computerized task. The data for this hypothetical study is shown in the table below.
| Small | Medium | Large |
| 4 | 6 | 8 |
| 2 | 3 | 7 |
| 2 | 5 | 7 |
| 3 | 4 | 9 |
| 3 | 5 | 8 |
| 4 | 3 | 6 |
a) Perform a complete hypothesis test. Test at the .05 level of significance.
Null hypothesis: Mean reaction time is the same based on the amount of caffeine intake.
Alternate hypothesis: Mean of at least one of the caffeine intakes is different
Alpha level: 5%
Decision criterion: if the p-value of F-stat is less than 0.05, we will reject the null hypothesis, else we do not have enough evidence to reject the null hypothesis.
Computation of F-stat
Group means and overall mean:
| Small | Medium | Large |
| 4 | 6 | 8 |
| 2 | 3 | 7 |
| 2 | 5 | 7 |
| 3 | 4 | 9 |
| 3 | 5 | 8 |
| 4 | 3 | 6 |
| Sum = 18 | 26 | 45 |
| Mean=3 | 4.333333 | 7.5 |
Overall mean = 18+26+45/18 =4.944
SSR = 6*(3-4.944)^2 + 6*(4.333-4.944)^2 + 6*(7.5-4.944)^2
= 22.685+2.241+39.185 = 64.111
Computing the SSE
SSE is computed as follows:
| Small | Medium | Large |
| 1 | 2.777889 | 0.25 |
| 1 | 1.777689 | 0.25 |
| 1 | 0.444489 | 0.25 |
| 0 | 0.111089 | 2.25 |
| 0 | 0.444489 | 0.25 |
| 1 | 1.777689 | 2.25 |
| Sum=4 | 7.333333 | 5.5 |
SSE = 4+7.333+5.5 =16.83
SST = SSR+SSE = 64.111+16.83 = 80.9411
MS between = 64.111/2 = 32.06
MS within = 16.83/15 = 1.1222
F=MS between/MS within = 32.06/1.1222 = 28.564
p-value for this F-stat at 2 and 15 degrees of freedom is close to zero.
Conclusion: Since the p-value of F-stat is less than 0.05, we will reject the null hypothesis concluding that at least one of the means is different.
b) Do you need to perform post hocs ? Explain but do not compute the post hocs.
Since the p-value of F-stat is less than 0.05 and we have concluded that at least one of the means is different, we need to conduct the post hoc to see which means are different.
c) Compute eta squared.
Eta squared = SSeffect/SStotal = 64.111/80.9444 = 0.79
d) Summarize your findings in a source table.
A one-way between-subjects ANOVA was conducted to compare the effect of the amount of caffeine on mean reaction time in a computerized task. There was found to be a statistically significant difference in the mean reaction time, F(2,15) = 28.56, p<0.05, ή2 = 0.79.