Statistical methods and analysis report
Below is a comprehensive report based on financial comfortability and risk-taking. It has an abstract, introduction, hypothesis, methodology, and results from sections. Tables and graphs are used within the project, and every concept is explained clearly.
Abstract
Risk-taking is a general, albeit controversial part of human life. Various factors have been proposed to affect risk-taking. However, the relationship between financial comfortability and risk-taking is less explored. This study looked at the relationship between the two variables using primary data collected through a questionnaire. Independent samples T-test was used to test the hypothesis that financially comfortable respondents will take more risk than respondents struggling financially. The result of the analysis shows no significant difference in risk-taking between the two groups of respondents.
Introduction
Risk-taking has been traditionally associated with gambles, skydiving, and bankers but it is a general, albeit, controversial part of human life. Almost all activities done involve one risk or the other, for example, walking out of the house to the street involves taking risks as one might get knocked down by a car or involved in any other form of accident. Risk-taking has a major role in all facets of our lives ranging from deciding to be self-employed or not, investing in stocks, innovation, health-related, and education choices (Hetschko and Preuss, 2020). Individuals differ according to their propensity to take risks and have been categorized into three: risk-loving, risk-averse and risk-neutral. A key challenge is determining the factors that influence the risk-taking propensity in people. Authors have looked at various variables including life experience (Ayton et al.,2020), age, gender, and cognitive ability (Falk et al, 2018). Cesarini et al. present evidence of genetic influence on risk-taking.
A factor that has not been well explored is the financial comfortability of individuals. A financially comfortable individual might engage in more risk-taking because they have satisfied the basic pressing daily need. However, an individual struggling financially may be more concerned with meeting the compulsory daily need and will not look into running a business or investing in a risky stock like a financially buoyant individual would have done. This effect of financial comfortability on risk-taking is underexplored in the literature as most studies dealing with financial focused on financial literacy. For example, Cavezzali et al., (2012) show that financial literacy positively affects the risk individuals are willing to take. Similarly, Aydemir and Aren (2017) found that financial literacy only moderate relationship between risk-taking and individual factors. Due to the limited study available on the effect of financial comfortability and risk-taking, this study took up the task to investigate the relationship between the two variables.
Hypothesis
The hypothesis of this study is stated as
H0: There will be no difference in risk-taking between financially comfortable participants and those struggling financially.
H1: Financially comfortable participants will report greater levels of risk-taking in life
Methodology
Data
The data is primary data collected through a questionnaire. The data include information on demographic statistics like age, gender, education of respondents, and their spouse. Moreover, measures of life risk-taking, dependency, financial comfortability, and lifestyle were collected. The total number of respondents is 400 and 20 variables in total were collected from them.
Variables
The study tests the hypothesis that financially comfortable participants will report greater levels of risk-taking in life. Therefore, the independent variable is a measure of risk-taking while the independent variable is financial comfortability. The measure of risk-taking is measured on a continuous scale while financial comfortability is a categorical nominal variable with two levels.
Methods
Both descriptive and inferential methods were employed in the analysis of the data. The descriptive statistics include graph and summary statistics which gives us quick information about the dataset but are not enough to make the decision. Inferential statistics on the other hand is used to test the hypothesis as it makes it possible to decide on rejection or not of the null hypothesis.
The graphs used for the study is Histogram which helps us to check the distribution of the measure of risk-taking as a whole and within the financial comfortability group. Summary statistics for the measure of risk-taking were presented. Moreover, the summary statistics were done for each group of the independent variable.
The inferential statistics used to test the hypothesis is the independent samples t-test. The test was suitable for the hypothesis because the dependent variable is continuous and the independent variable is categorical with two groups only. Moreover, the two groups are independent in the sense that it is not possible for one respondent to fall into the two groups. The necessary assumptions include normality of dependent variables for each group of independent variables, equality of variance, and no outliers. The normality assumption is tested with group histogram, Levene test is used for equality of variance, and boxplot was used to test for outliers.
Result
Descriptive Statistics: Univariate Analysis
Figure 1 presents the histogram of the risk-taking measure for the respondents. The histogram is useful to view the distribution of the variable among the respondents. The plot shows there distribution of risk-taking among respondents is fairly normally distributed as we could not observe evidence of skewness in the graph.
Table 1 presents the summary statistics of the measured risk-taking for the respondents. We found that the average value of risk-taking among respondents is 36.51 which means on average, the risk-taking score of each respondent is 36.51. The standard deviation which measures the variation of individual score from the mean is 8.34. The skewness value is -0.072 which is close to zero expected for data that follows the normal distribution. Taken with the standard error, the skewness is not significant and the same can be said of excess kurtosis. The lowest risk-taker had 15 points while the most risk-taker has 58 points on the risk-taking scale.
Table 1: Descriptive Statistics
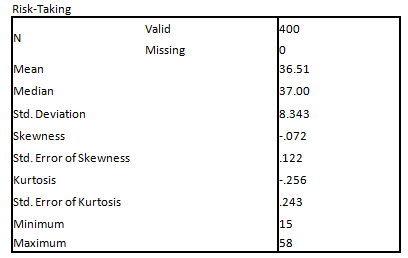
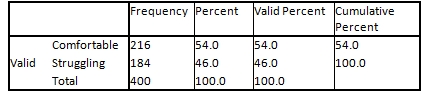
Table 2 presents the frequency distribution for the independent variable – financial comfort – the result shows that 54% (n=216) of the respondents reported that they are financially comfortable while 46% reported that they are struggling financially
Table 2: Frequency Distribution
Financial Comfort
Descriptive Statistics: Bivariate Analysis
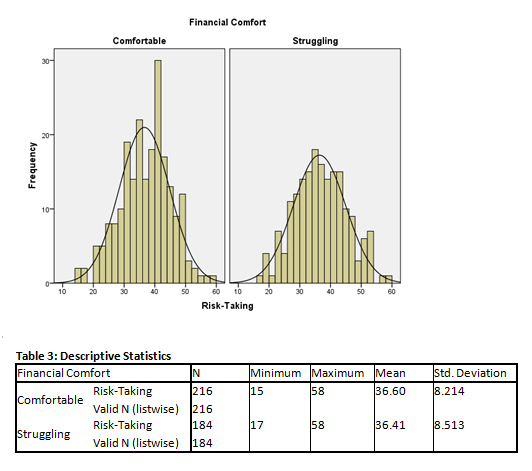
Fig 2 presents the histogram showing the distribution of risk-taking by the financial comfortability group. The plot shows that risk-taking exhibits a fairly normal distribution for both the comfortability and struggling group. However, the distribution for the struggling group is less peaked compared to the comfortable group
Table 3 presents the group-wise summary statistics for risk-taking measures. The result shows that average risk-taking is higher for the group that is financially comfortable (M=36.60, SD=8.21) than the group which is struggling financially (M=36.41, SD=8.51) but variation is slightly higher for the struggling group than the comfortable group.
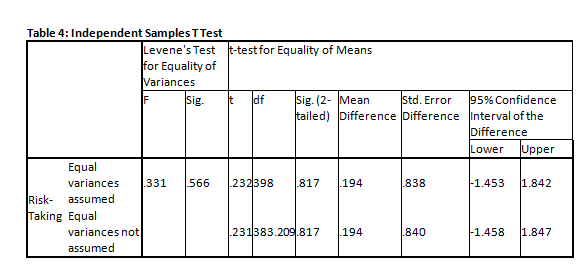
Inferential Statistics: Independent Sample T-test
As stated before, the inferential analysis used is the independent t-test because the independent variables have two groups which are independent because data are collected from them only once. The result is presented in table 4. The Levene test of equality of variance was first presented. The test result shows that F=0.33, p=.57 which connotes nonrejection of null hypothesis that the variance are the same. Based on this, we conclude that the variance of the two groups is the same which means we interpret the result of the T-test assuming equal variance. The test statistics for the independent samples T-test is t(398) = 0.232, p=0.84>.05. since the p-value (.84) is greater than the level of significance (.05), we could not reject the null hypothesis that average risk-taking is not significantly different for the two groups. Thus, risk-taking does not differ depending on financial comfortability status.
Discussion and Conclusion
…………………………………… Thus, the study tested the hypothesis that “Financially comfortable participants will report greater levels of risk-taking in life”. Independent samples t-test was then used to test this hypothesis after the necessary assumptions have been met. The result shows that average risk-taking in life is not significantly different among the two groups. This means that respondents who are financially comfortable do not take more risks than those who are financially struggling. Therefore, the hypothesis that the study tests were not supported by the result. The reason for this may not be unconnected with the fact that financial comfortability is self-reported. However, what one individual interprets as financial comfort may be interpreted as a financial struggle by another. It implies that we may see a respondent reporting themselves as financially struggling but are doing well than those who reported themselves as financially comfortable. The result might be different if there is a threshold used to segregate respondents into the two groups.