Five-Step Hypothesis Test
These two solutions test hypotheses within five steps to make them look less complicated and feel less burdensome. We developed accurate solutions to give a clearer picture of the hypothesis testing process. The five steps involve identifying the null and alternative hypotheses, finding the associated distribution, finding the critical value, calculating the test statistic, and finally making the decision.
1. Burglary data are presented below, based on neighborhood and victim race variables. Conduct a five-step hypothesis test, using chi-square and an alpha level of .05, to assess whether there is a bivariate relationship between neighborhood and victim race. Additional tables are provided to assist you.
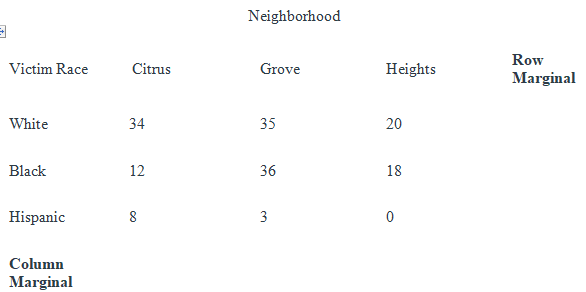
Step 1: State the H0 and the H1.
H_0:There is an association between neighborhood and victim race
H_1:There is a significant association between neighborhood and victim race
Step 2: find the associated distribution and calculate the degrees of freedom.
The test statistic is Chi-squared with 2*2 = 4 degrees of freedom.
Step 3: Find the critical value and give the decision rule.
Critical value = 9.49.
Decision rule: Reject the H0 if χ_test^2>χ_critical^2=9.4
Step 4: Calculate the obtained value of the test statistic. Write all answers to 2 d.p.
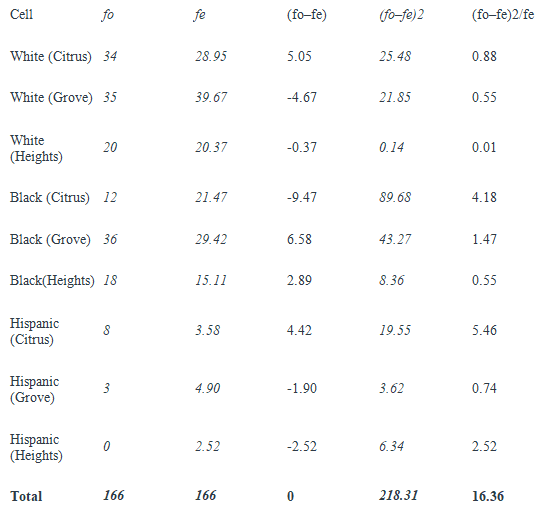
Test Statistic is 16.36
Step 5: Conclusion
We reject the null hypothesis as χ_test^2>χ_critical^2, and conclude that there is enough evidence for significant association between neighborhood and victim race.
2. Using an alpha = .05, complete an independent samples t-test utilizing the data shown below. Assume the variances are equal.
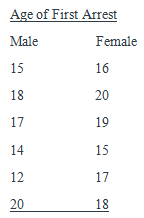
male mean = 16 female mean= 17.5
male s = 2.90 female s = 1.87
Step 1: State the H0 and the H1.
H_0: μ_male= μ_female
H_1: μ_male≠μ_female
Step 2: Calculate the df:
Degrees of freedom is n1+n2-2 = 10
Step 3: Identify the critical value for α = .05 and state the decision rule.
The critical value is 2.23.
Decision Rule: Reject H0 if |t|>2.23.
Step 4: Calculate the obtained value of t.
s_p^2=((N_1-1) s_1^2+(N_2-1) s_2^2)/(N_1+N_2-2)
s_p=2.44
T=((Y_1 ) ̅-(Y_2 ) ̅)/s_(p√(1\/N_1+1\/N_2 ))
Hence, t = -1.06
Step 5: Conclusion
We failed to reject H0 since|t|<2.23 and conclude that the age of first arrests for males and females are significantly different.
3. A researcher is hired to study crimes against theme park visitors, to investigate whether theft rates differ across the different amusement parks in the state. Data are presented below on three parks. Conduct an ANOVA to see if there are any statistically significant differences between the parks in terms of thefts. Alpha = .05.
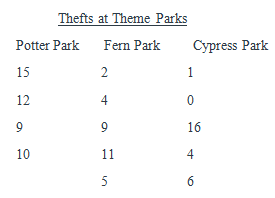
Step 1: State the H0 and H1.
H_0: μ_(Potter Park)= μ_(Fern Park)=μ_(Cypress Park)
H_1:H_0 is false
Step 2: Calculate the degrees of freedom.
The degree of freedom is 2,11 for F-distribution.
Step 3: Identify the critical value, and state the decision rule.
The critical value is 3.98.
Decision Rule: Reject the null hypothesis if F>3.98
Step 4: Compute the value of the test statistic.
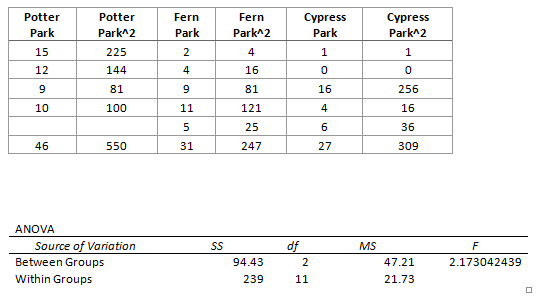
F= 2.17.
Step 5: Conclusion.
We failed to reject H0 since F < 3.98 and conclude that the thefts at different theme parks are significantly different.
4. Utilizing the two continuous variables shown below, establish null and alternative hypotheses and calculate the correlation between the variables. State the decision with regard to whether the H0 is ultimately rejected or retained, with alpha = .05, and calculate and interpret the coefficient of determination.
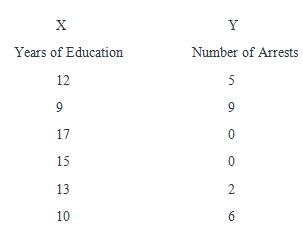
Step 1: State the H0 and the H1.
H_0:r=0
H_1:r≠0
Step 2: Identify the distribution and compute the df.
Distribution is t, with n-2 degrees of freedom. Hence, dof = 4
Step 3: Identify the critical value of the test statistic and state the decision rule.
Critical value is t_crit=2.78
Decision rule: Reject H0 if |t|>2.78
Step 4: Compute the obtained value of the test statistic
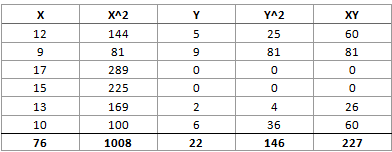
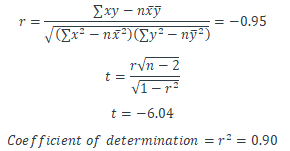
Step 5: Make a decision about the null and state the substantive conclusion, including the use of the coefficient of determination.
We reject the null hypothesis as |t|>2.78. We conclude that there is a significant association between years of Education and the number of arrests. The coefficient of determination of 0.90 represents that years of education are able to explain 90% of the variation in the number of arrests through a linear relationship.