Problem Description
The focus of this Statistical Analysis homework is to investigate potential influences on home prices. We aim to predict house sale prices using multiple regression analysis, considering various parameters such as house area (in square feet), the number of bedrooms, bathrooms, and parking spaces. This analysis is based on data from two datasets: "P1 Gate Suite T3" and "P1 Condosales T3." The findings indicate a significant relationship between these variables and house prices, offering valuable insights for real estate market analysis.
Solution
Executive Summary
Investigating potential influences on home prices is the focus of the current study. To predict house sale prices, the study used the following parameters to perform a multiple regression: house area (in square feet), number of bedrooms, bathrooms, and parking space. The study obtained information on 32 and 76 individual properties for house sales from the data set "P1 gate suite T3 and P1 Condosales T3" Given that the p-value is less than 0.05, the model's findings point to a link between the variables examined and price. In many real estate markets, a home's number of bathrooms and bedrooms is a significant factor in determining its sale price. Homes with more bathrooms sell for a greater price per square foot than homes with fewer bathrooms, while homes with more bedrooms often sell for a higher price. Real estate market analysis includes understanding how the selling price of a home relates to its size, number of bathrooms, bedrooms, parking spots, and other features. This understanding can offer crucial insights into the variables that influence the sale price of homes in a particular market.
Introduction
Home purchasers take various housing factors, like the property size and location, into account while making their selections. Buyers are prepared to pay more for a home with a beautiful view since it adds to its aesthetic appeal and makes it more desirable. Thus, views of the water, sea, beach, or forest significantly determine a home's valuation. It is anticipated that there would be a significant correlation between housing-related facilities and values since purchasers seek to maximize connected amenities, such as structural and location-related facilities.
The number of bathrooms, bedrooms, parking spots, and house size are just a few variables that affect a home's sale price. These elements may significantly influence a property's perceived value and, consequently, its final sale price. For instance, a home with more bedrooms and baths may be priced higher than a home with fewer amenities, while a parking spot may be considered an extra perk and draw higher bids. The size of the house can also have a significant influence on its cost; generally, larger homes are more expensive. The property's location, the local real estate market, and the standard of the finishing can all affect how much a house sells.
Numerous research has been undertaken on the correlation between a home's sale price and its size, number of bathrooms, bedrooms, and parking spots, and these investigations have resulted in a sizable body of literature. Demand for home attributes and hedonic pricing models examine the association between housing attributes and the sale price of homes in the UK using hedonic pricing models. A home's number of bedrooms and bathrooms are reliable indicators of its sale price. Parking's effect on property prices presented looked into how parking affected Los Angeles home sales prices. Homes with designated parking spaces sell for more money than those without.
Effects of housing attributes on single-family house sales prices - The association between single-family home sale prices and several housing attributes, such as the number of bedrooms and bathrooms, parking spots, and house size, is examined. Each of these elements significantly affected how much the properties sold.
A Melbourne, Australia, case study demonstrated the consequences of estimating the effects of property attributes on house prices. In this study, hedonic pricing models were used to examine the correlation between the sale price of homes in Melbourne and a variety of housing attributes, such as the number of bedrooms and bathrooms, the number of parking spots, and the size of the home. According to the study's findings, all of these elements significantly impacted the sale price of the homes. These studies show that a house's size, number of bathrooms, bedrooms, parking spots, and other characteristics can all significantly affect its sale price, but the extent to which they do so depends on the location, the state of the local real estate market, and the techniques used to gather and analyze the data.
Market Identification
An essential component of real estate market analysis is the correlation between the sale price of a home and the number of bathrooms, bedrooms, parking spots, and size of the home. This connection may be used to spot patterns in the real estate market, offer insights into consumer preferences, and help real estate brokers, house sellers, and home purchasers make decisions. A home's number of bathrooms and bedrooms is sometimes seen as a significant factor in its sale price. For instance, homes with more bathrooms often sell for more per square foot than homes with fewer bathrooms, but homes with more bedrooms typically sell for more overall. In some markets, the availability of a parking spot is also significant. According to surveys, homes with designated parking spaces sell for more money than those without. A house's size can affect the price at which it sells, with larger homes frequently fetching a greater price than smaller ones. However, this relationship may be more complicated since larger homes may also be linked to other elements, such as higher-quality finishes, that affect the sale price. Real estate market analysis should consider the link between a home's sale price and size, number of bathrooms, bedrooms, and parking spots. This information can offer crucial insights into the variables influencing a home's sale price in a particular market.
To better understand the variables that affect the value of residential properties, the current study examines the relationship between a home's sale price and its size, number of bathrooms, bedrooms, and parking spots. Various stakeholders may find this material valuable.
Data Exploration
This study uses the data set named "P1_gatesuite_T3." This data set provides information about the indicated size per square foot, number of bedrooms, bathrooms, floor, etc., for 32 properties. There are no potential difficulties to explore in this case study: gaps in the database, data keying mistakes, and abnormalities such as severe or outliers in the variables. A rigorous data-cleaning procedure was carried out to examine these concerns. It includes looking for missing values in the data and filling in any gaps in the database. Data keying mistakes were addressed by evaluating the data and making necessary adjustments. Any abnormalities ins the continuous variables, such as extremes or outliers, were treated by eliminating the outliers.
The categorical variables were transformed into new variables by assigning codes to each category to reduce the project's complexity. For example, in the "view" variable, the north category was given a code of 1, the south category was assigned 2, and the west category was given 3. In the "laundry" variable, the "yes" category was given a code of 1, and the "no" category was assigned 0.
We analyze and categorize each variable based on its qualities and the data it contains to determine the variable type in a data collection. In this P1_gatesuite_T3 data set, the variable "SizeSqFt" is a continuous variable measured on an interval/ratio scale. The variable "view" is a categorical variable and has three categories (South, North, West, East), while "Laundry" is a binary variable because it has only two categories (yes, no). Both are measured on a nominal scale. The remaining variables, floor, bedrooms, and bathrooms, are quantitative and measured on the nominal scale. The description is a text variable because it holds textual data.
There are various ways to reduce this data utilizing data reduction techniques. The Dimensionality Reduction approach reduces the number of variables in a data collection, making it easier to analyze and interpret. Aggregation is merging data from numerous sources into a single data collection, simplifying and simplifying data analysis. Clustering group-related data points minimize data complexity and make it easier to interpret. Sampling is another data reduction method that is the process of choosing a smaller portion of the data to simplify and make it easier to examine.
Statistical summaries often reduce data, but they depend on assumptions about the distribution structure of the variables that may or may not hold. The initial data reduction strategy is to acquire some basic statistics for the variables to be analyzed's central tendency and dispersion. We calculated the descriptive statistics of the quantitative variable in terms of mean, median, and standard deviation to investigate if they have similar ranges and variability. Descriptive statistics can provide a summary of each variable's central tendency and dispersion, allowing us to compare the distributions of the variables.
Data reduction can assist in overcoming the inadequacies of a visual scan, for example, by computing summary statistics. The summary statistics table of the quantitative variables is described in the appendix (Table 1).
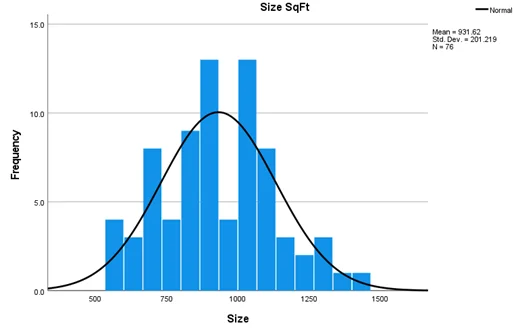
The variable SizeSqFt has a mean value of 931.62 with a standard deviation of 201.219. This variable ranges from 0.550 to 1411 size per square foot. It has a median value of 914, indicating that 50% of observations are above this figure and 50% below it. Since the mean is significantly less than the median, the SizeSqFt has a negatively skewed distribution. Graph 1, represented in the appendix, also indicates that this variable follows the left-tailed distribution. It means most observations are bunched up on the left side of the graph and then tailing off to the right.
The houses have a 2.37 average number of floors with a standard deviation of 0.969. It has a maximum of four floors and a minimum of one floor. The results stated that variable bedrooms have an average value of 1.822 with SD = 0.4740, while the number of bathrooms has a mean value of 1.568 with SD = 0.4705. Since the view and Laundry are the categorical variables, the mode is appropriate to measure of central tendency for these variables. The view has a mode value of 2, representing the north category. At the same time, the Laundry had the mode value of 0, which indicated the category of "no" in the data set. The frequency distribution table of these categorical variables is presented in the appendix section (Table 2,3).
We calculated the correlation matrix to investigate the relationship between the different variables. The correlation analysis examined how specified variables are correlated with each other. It also measures the direction of the relationships. Table 4, pasted in the appendix, determined the correlation analysis between different variables. The Pearson Correlation coefficient measures the strength and direction of the relationship between two variables. A coefficient of 1 indicates a strong positive correlation, while a coefficient of -1 indicates a strong negative correlation. A coefficient of 0 indicates no correlation between the two variables.
The analysis results show no correlation between the floor and any of the other variables, as indicated by the coefficients of correlation is .000, and its associated p-value is more than a 5% significant level, p = 1.000. However, there is a significant and strong positive correlation between bedrooms and size (SqFt), r = .792, p <.001. It indicates that as the number of bedrooms in a property increases, the size of the property also increases. There is also a significant and strong positive correlation between bathrooms and size (SqFt) as r = .773, p <.001. It means that as the number of bathrooms in a property increases, so does the size of the property.
It should be noted that the correlation between the variable and itself is 1, as the correlation between the number of bedrooms and itself. It is because a variable has a perfect positive correlation with itself. Overall, these findings indicate that a property's number of bedrooms and bathrooms strongly impacts its size but not the floor on which it is located.
Although the correlation coefficient between two variables is a useful statistic for determining the strength of the association, it has some limitations when it comes to gauging linearity. The value might be deceiving. As a result, it is usually a good idea to examine a scatter plot to see the relationship between the variables indicated by their correlation coefficient.
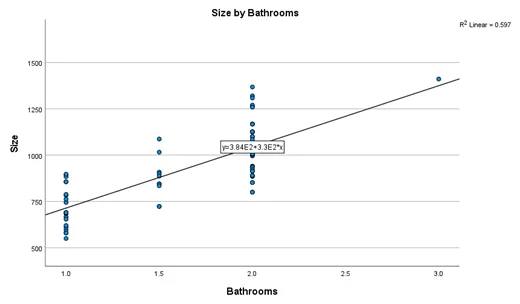
Graph 2 indicates the strong and positive relationship between the size and the number of bathrooms. As the size of the property increases, the number of bathrooms also increases. This relationship also appears linear, meaning that the increase rate is constant. Graph 3 indicates the strong and positive relationship between the size and the number of bedrooms. As the size of the property increases, the number of bedrooms also increases. This relationship also appears linear, meaning that the increase rate is constant.
Our visual examination of the relationship between the variables through scatterplots revealed that a straight-line model is appropriate for predicting apartment size in this market. However, it uncovered a few outliers in one building that diverged from the rest of the observations and may warrant further investigation. Despite this, the scatterplot remains a valuable tool for discovering the nature of the relationship between the variables.
Valuation Analysis
The P1 Condosales T3 dataset was used to analyze the method affecting the selling price. The data set consisted of many variables, but the interesting variables for the current study were house selling price, size (sqrt ft), number of bathrooms, and bedrooms. Multiple linear regression analysis was used to analyze the relationship between selling price, size (sqrt ft), and the number of bathrooms and bedrooms. The purpose of valuation analysis is to determine a property's market worth valuation analysis involves examining pertinent elements such as its size (square ft), the number of bedrooms and bathrooms, and the selling prices of nearby, similar properties. Larger homes are more expensive, and homes with more bedrooms and baths are usually more expensive. The property's location, state, and amenities might impact the link between these elements and the selling price, which is not always clear-cut.
Regression analysis is a statistical technique that enables you to assess the effect of one variable on another and describe the relationship between several variables. In this case, the independent factors (size, Number of bathrooms, and Number of bedrooms) impact the dependent variable (selling price). With the help of the regression analysis, we estimated the selling price of a home based on its size, Number of bathrooms, and Number of bedrooms by creating an equation that demonstrates the link between the variables.
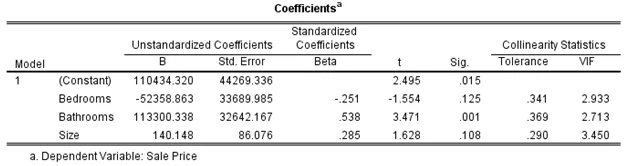
The regression analysis results demonstrate that F(3,72)=11.3606,p<.001 showing a significant relationship between selling price, size, Number of bathrooms, and Number of bedrooms accounting for 36.2% variation in it. Only the number of bathrooms was the significant predictor as p<.05. The number of bathrooms and size of the house caused an increase in selling price by $113300 and $141, while the number of bedrooms caused an increase in the value by $52539.
Recommendations
A few suggestions can be made to real estate experts based on the findings of the value analysis: Larger homes often sell for more money. Therefore, highlighting a property's square footage might raise its perceived worth. Properties with more bedrooms and bathrooms are sometimes more expensive. For prospective buyers, highlighting the number of bathrooms and bedrooms a house has can be a selling factor. A property's value is significantly influenced by its location. To raise the perceived worth of the house, be sure to draw attention to the appealing qualities and facilities of the neighborhood. The real estate industry is dynamic; therefore, it's critical to keep informed about recent developments and modify your marketing plan appropriately. Other elements might affect a property's worth, including size, the number of bathrooms and bedrooms, and location. When estimating a property's worth, evaluate all pertinent elements.
When promoting properties and establishing their worth, these suggestions should be considered, but it's also crucial to remember that the real estate industry is intricate and always changing, so it's crucial to continuously re-evaluate and update our research.
Conclusion
The findings of the multiple regression model indicate that the model, which contains the following variables: size, number of bathrooms, and number of bedrooms, accounts for 36.2% of the variability in price. There is a significant correlation between pricing and the factors that were looked at since the p-value is so small. In the future, it might be interesting to look into how to handle independent variables that could be related to one another, as well as whether or not the independent variables and the dependent variable have only linear relationships or whether one or more independent variables may have potential squared relationships or other quadratic relationships.
Appendix
Table 1: Summary Statistics
| Floor | Bedrooms | Bathrooms | Size | |
|---|---|---|---|---|
| Mean | 2.37 | 1.822 | 1.658 | 931.62 |
| Median | 2.00 | 2.000 | 2.000 | 914.00 |
| Std. Deviation | .969 | .4740 | .4705 | 201.219 |
| Minimum | 1 | 1.0 | 1.0 | 550 |
| Maximum | 4 | 3.0 | 3.0 | 1411 |
Table 2: Frequency distribution of variable view
| Frequency | Percent | Valid Percent | Cumulative Percent | ||
|---|---|---|---|---|---|
| Valid | EAST | 14 | 18.4 | 18.4 | 18.4 |
| NORTH | 26 | 34.2 | 34.2 | 52.6 | |
| SOUTH | 15 | 19.7 | 19.7 | 72.4 | |
| UNKNOWN | 8 | 10.5 | 10.5 | 82.9 | |
| WEST | 13 | 17.1 | 17.1 | 100.0 | |
| Total | 76 | 100.0 | 100.0 | ||
Table 3: Frequency distribution of variable Laundry
| Frequency | Percent | Valid Percent | Cumulative Percent | ||
|---|---|---|---|---|---|
| Valid | N | 47 | 61.8 | 61.8 | 61.8 |
| Y | 29 | 38.2 | 38.2 | 100.0 | |
| Total | 76 | 100.0 | 100.0 | ||
Table 4: Correlation Analysis between different quantitative variables
| Size | Bedrooms | Bathrooms | Floor | ||
|---|---|---|---|---|---|
| Size | Pearson Correlation | 1 | .792** | .773** | -.024 |
| Sig. (2-tailed) | <.001 | <.001 | .839 | ||
| N | 76 | 76 | 76 | 75 | |
| Bedrooms | Pearson Correlation | .792** | 1 | .725** | .045 |
| Sig. (2-tailed) | <.001 | <.001 | .701 | ||
| N | 76 | 76 | 76 | 75 | |
| Bathrooms | Pearson Correlation | .773** | .725** | 1 | .080 |
| Sig. (2-tailed) | <.001 | <.001 | .495 | ||
| N | 76 | 76 | 76 | 75 | |
| Floor | Pearson Correlation | -.024 | .045 | .080 | 1 |
| Sig. (2-tailed) | .839 | .701 | .495 | ||
| N | 75 | 75 | 75 | 75 | |
**. Correlation is significant at the 0.01 level (2-tailed).
Graph 1: Histogram of Size (SqFt)
Graph 2: Scatterplot between Size (SqFt) and number of bathrooms
Graph 3: Scatterplot between Size (SqFt) and number of bedrooms
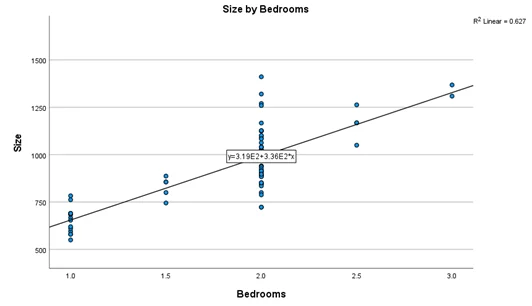
Table 6
Model Summary
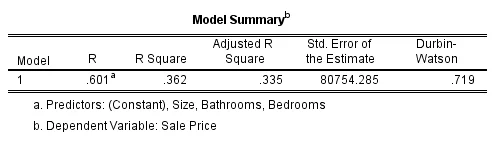
Table 7
Relationship between sale price, size, number of bathrooms & bedrooms & parking space
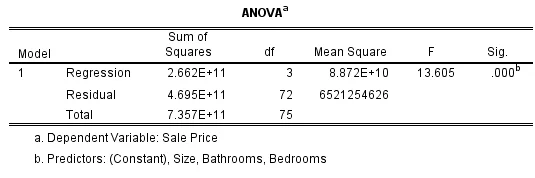
Table 8
Predictors statistics
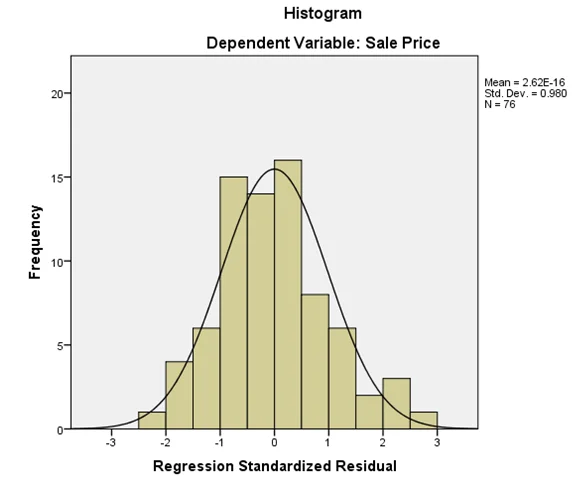
Graph 5: Distribution of house sale price
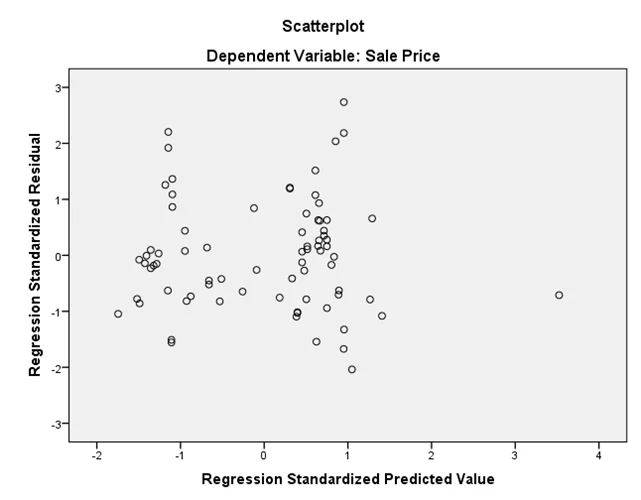
Graph 6: Homogeneity of variance