Problem Description:
In this Statistical Analysis assignment, we are presented with a dataset and asked to perform various analyses on it. We have two key statistical parameters, the sample mean (x̅) and the sample standard deviation (S_x), which are 56.04242 and 3.312479, respectively. The primary objective is to understand the distribution of the data and compute the percentage of data points within certain standard deviation intervals.
Solution
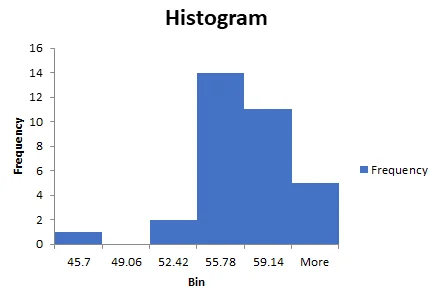
- Histogram
- Histogram with normal curve
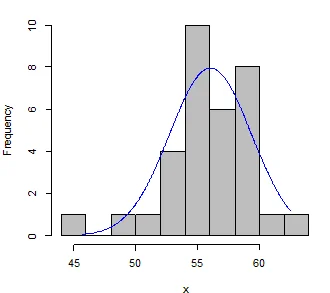
The shape of the distribution is not symmetrical. It is skewed to the left.
- One standard deviation interval
Lower 52.72994
Upper 59.3549
- It is 24/33 = 72.72%
- two standard deviation interval
Lower 49.41747
Upper 62.66738
- It is 32/33 = 96.97%
- 68% of data supposed to fall within one standard deviation
- 95% of data supposed to fall within two standard deviation
- 99.7% of data supposed to fall within three standard deviation