Problem Statement:
This correlation analysis assignment focuses on using multiple regression and correlation analysis to investigate the relationship between the age of Certified Flight Instructors (CFIs), the total hours they have spent in training aircraft, and their levels of complacency. The primary goal is to address three key research questions:
- Is there a significant relationship between CFIs' age (X1), total hours in training aircraft (X2), and their level of complacency (Y)?
- Does CFIs' age (X1) significantly predict the level of complacency (Y)?
- Does the total number of hours CFIs' logged in their primary training aircraft (X2) significantly predict the level of complacency (Y)?
Solution
- Priori Activities
- Research Questions
- Is there a significant relationship between the CFIs’ age (X1), total hours in training aircraft (X2), and their level of complacency (Y)?
- Does CFIs’ age (X1) significantly predict the level of complacency (Y)?
- Does the total number of hours CFIs’ logged in their primary training aircraft (X2) significantly predict the level of complacency (Y)?
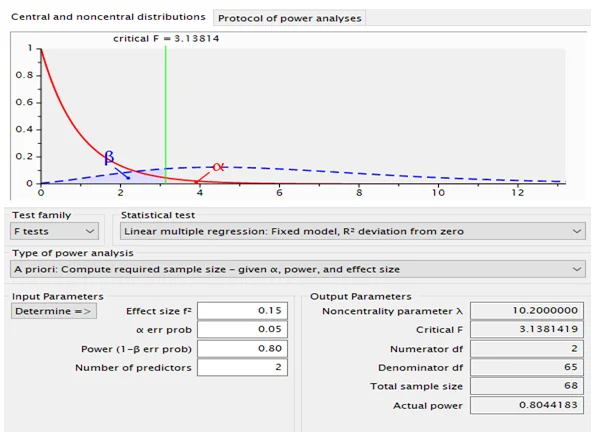
- Sample Size
- Preliminary Data Analysis
- Primary Data Analysis
- The R2 value explains the proportion of variance in the dependent variable caused by the independent variables. The R2Y•12 value (0.063) from the model summary table above indicates that CFIs’ age and the total number of hours CFIs’ logged in their primary training aircraft explain 6.3% of the variability in the level of Complacency.
- The regression model was obtained as;
- The average expected level of complacency is 12.949 if the CFI has not logged in to their primary training aircraft.
- The level of complacency increases by 0.08 for every unit increase in the CFIs’ age while the total number of hours CFIs logged in their primary training aircraft is held constant.
- Also, for every unit increase in the total number of hours CFIs logged in their primary training aircraft, the level of complacency increases by 0.0001 holding the CFIs’ age constant.
- The multiple correlation coefficient was obtained as 0.063. The correlation between the level of complacency and CFIs’ age was obtained as 0.243 while the correlation between the total hours in training aircraft and level of complacency was obtained as 0.028
- It can be concluded from the results of the analysis that;
- There is a significant relationship between the CFIs’ age (X1), total hours in training aircraft (X2), and their level of complacency (Y)
- CFIs’ age (X1) significantly predicts the level of complacency (Y)
- The total number of hours CFIs logged in their primary training aircraft (X2) does not significantly predict the level of complacency (Y)
- Post-Primary Data Analysis
- The effect size obtained value of 0.067 indicates that the model's practical application is limited
- The sr21 has an effect size of 0.32 and sr22 has an effect size of 0.028 showing a large and small effect size respectively.
- The power of the model was obtained to be 0.92 which indicates the significance of the relationship between the three variables.
- The power was obtained to be 1 and 0.6724 for both sr21 and sr22 respectively which show that the variation in complacency by the CFI age and total hours in training aircraft is significant.
- The overall regression model is significant although with a small coefficient of determination. The model can be used for decision but the emphasis has to be placed on the CFI age to get an optimal estimate of the level of complacency.
According to the G-power, the required sample size with 0.15 effect size, 0.05 level of significance, and 0.8 power is 68. The given sample size is sufficient for the study considering the calculated minimum sample size. The given large sample size will increase the credibility of the research result.
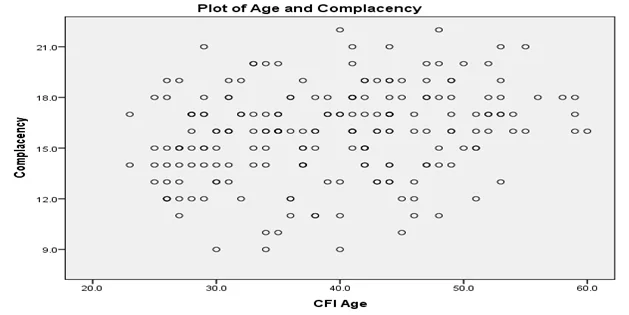
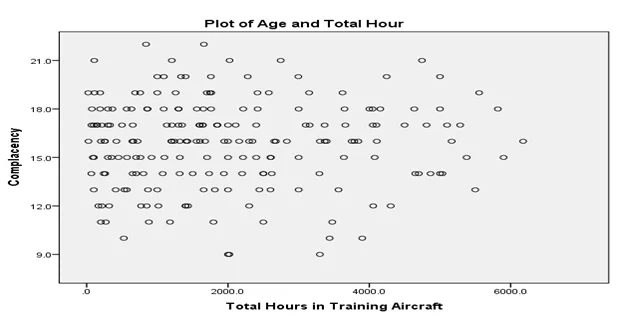
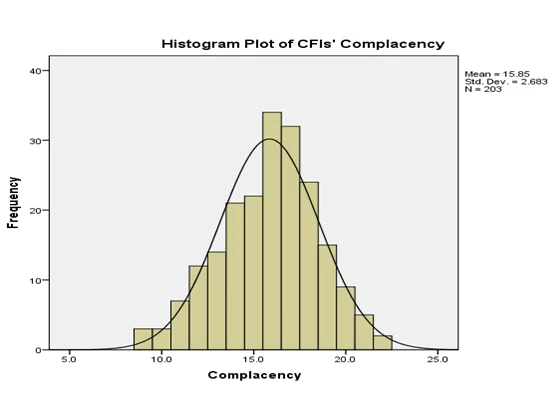
The assumptions of multiple regression are not violated by the data. There exists a linear relationship between the dependent variable (complacency) and the independent variables (CFIs’ age and total number of hours they have logged in their primary training aircraft). Also, the dependent variable is normally distributed. The figures below give the visualization of the linearity and normality assumptions respectively.
The tables below give the output of the multiple regression analysis
Model Summary
| Model |
R |
R Square |
Adjusted R Square |
Std. Error of the Estimate |
|---|---|---|---|---|
| 1 |
.251a |
.063 |
.054 |
2.6097 |
ANOVA
| Model |
R |
R Square |
Adjusted R Square |
Std. Error of the Estimate |
|---|---|---|---|---|
| 1 |
.251a |
.063 |
.054 |
2.6097 |
Coefficients
| Model |
R |
R Square |
Adjusted R Square |
Std. Error of the Estimate |
|---|---|---|---|---|
| 1 |
.251a |
.063 |
.054 |
2.6097 |