QUESTION:
1. Create two histograms, one for males and the other one for females to show the visual interpretation of the data given.
2. Create descriptive tables to assess measures of central tendency and dispersion using the GPA and Quiz3
Descriptive data analysis using SPSS
The following are assignment solutions that include histograms and descriptive tables used to visualize the data based on the final scores of male and female students. There are two histograms, one for males and another for female students. They are followed by descriptive tables that give a description of the skewness, kurtosis, measures of central tendency, and dispersion for GPA and quiz 3.
A Histogram for Female Students
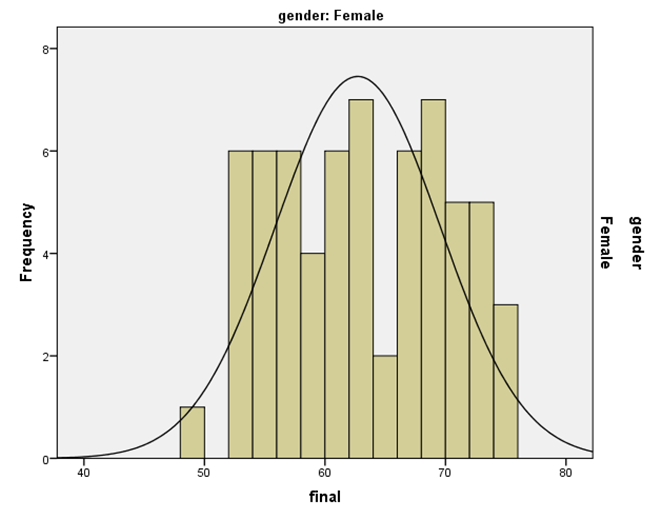
From the histogram above, it can be seen that the final grade in female students is not normally distributed as most of the grades are clustered around a point. It portrays some elements of skewness.
A Histogram for Male Students
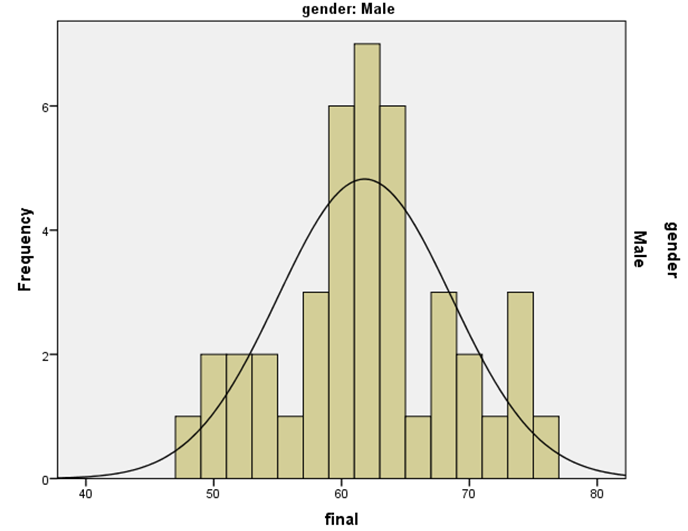
The histogram above shows that the final grades for male students are normally distributed. The distribution is leptokurtic because the histogram is relatively peaked at the center.
Descriptive Table for Females
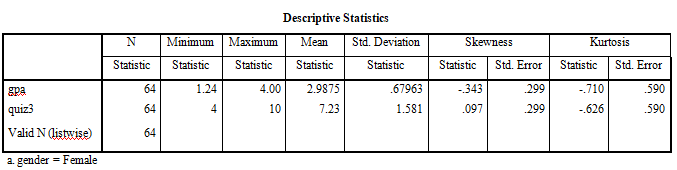
For female students, the mean GPA is 2.987 with standard deviation 0.6796, Skewness = - 0.343 and Kurtosis = -0.71. However, the mean score for quiz3 for female students is 7.23 with a standard deviation 1.581, skewness=0.097 and kurtosis=-0.626
Descriptive Table for Males
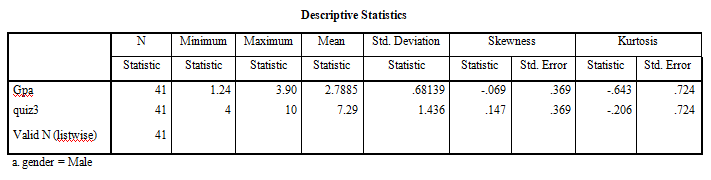
For male students, the mean GPA is 2.7885 with standard deviation 0.6814, Skewness = - 0.069 and Kurtosis = -0.0643. However, the mean score for quiz3 for male students is 7.29 with a standard deviation of 1.436, skewness=0.147 and kurtosis=-0.0206
Description of the skewness and kurtosis
It is observed from the tables above, that the skewness in GPA for both male and female students is negative. This means that GPA has a negatively skewed distribution but quiz3 scores are positively skewed as the skewness values for male and female are greater than zero. However, the skewness in GPA for male is closer to zero, which means that GPA for male students is approximately normal.
Also, the kurtosis values greater than 0.263 are said to be leptokurtic in nature which means they are not normal. Therefore, the kurtosis for male students GPA indicates that the GPA is approximately normal but not the case in the female GPA as well as the score in quiz3.