+1 (315) 557-6473 

SPSS Data Analysis Homework Solution

Get access to free solutions on SPSS data analysis online on our website. The solutions developed by us are flawless and straight to the point. That's why you can use them to learn and revise for exams. What's better, we don't charge you a dime to go through them. Get access to free solutions on SPSS data analysis online on our website. The solutions developed by us are flawless and straight to the point. That's why you can use them to learn and revise for exams. What's better, we don't charge you a dime to go through them. 

Frequency Tables and Measures of Central Tendencies


Below are solutions to questions on frequency tables, measures of central tendencies, and other concepts of data analysis using SPSS. Mean, median, and standard deviation are some of the calculated parameters. A histogram pie chart, dot plot, and frequency polygon are constructed to give a visual presentation of the data.

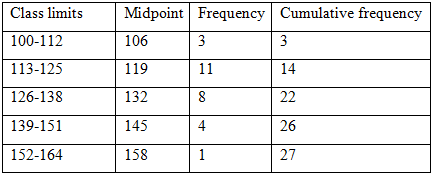
Creating a Detailed Frequency Table


Description: The data set represents the number of minutes a sample of 27 people exercise each week  

                                            108 139 120 123 120 132 123 131 131
                                                     
                                                     157 150 124 111 101 135 119 1 6 117
                                                             
                                                              127 128 139 119 118 114 127 142 130

1.- Construct a frequency distribution for the data set. Include class limits, midpoints boundaries, frequencies, and cumulative frequency. Describe each graph. 

SPSS Data Analysis 1

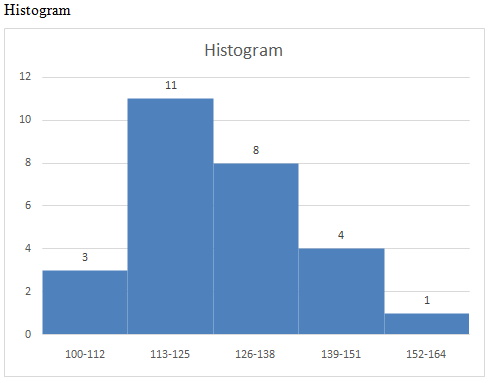
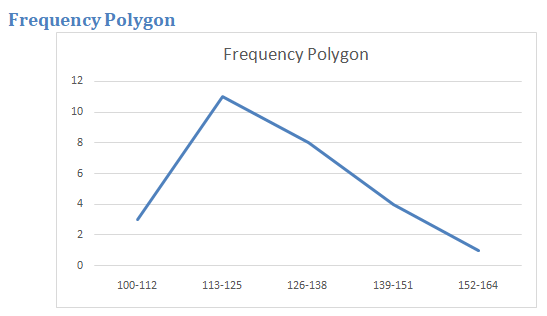
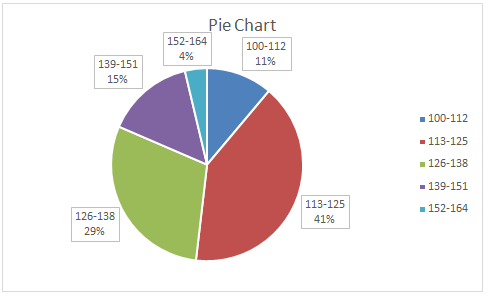
Generating a Histogram for the Table 


2.- Display the data, using a frequency histogram and a frequency polygon. 

SPSS Data Analysis 2
SPSS Data Analysis 3
3.- Display the data using a stem and leaf plot.
SPSS Data Analysis 4

5.- Make a pie chart graph.

SPSS Data Analysis 5

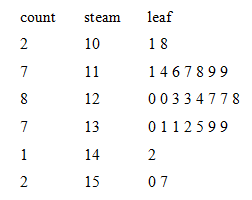
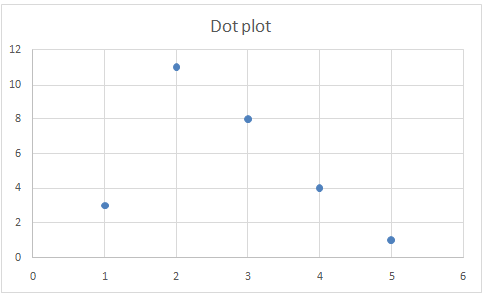
Constructing a Dot Plot 


SPSS Data Analysis 6

Finding the Measures of Central Tendency 

SPSS Data Analysis 7

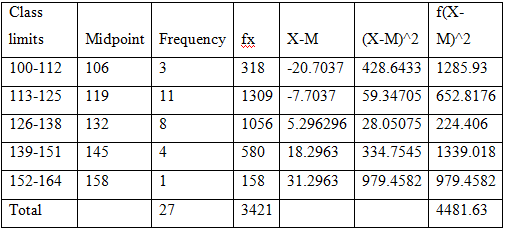
Mean =∑▒〖∑▒fx/f=3421/27=126.7037〗

Median = 1/2 (27)=13.5

Therefore, the median will be in the class limit 113-125

Mode = 11 which is the range for 113-125

Standard deviation = √(∑▒(f(X-M)^2)/f)=√(4481.63/27)=12.8836

Finding the coefficient of variation and CI


Coefficient of variation =σ/μ=12.8836/126.7036=0.1017=10.17%

 Confidence interval for Mean

confidence interval=x ̅±Z σ/√n

=126.7037±1.96(12.8836/√27)

=12.7037±4.8597

=(121.844,131.536)

The confidence interval for the mean is 122.844 and 131.536

Testing the hypothesis


10.- The coach claims that meantime the number of 27 people exercising is more than125 minutes each week. Can you support the claim, using a level of significance of 0.05?

Ho:μ=125

H1:μ>125

Level of significance =5% = 0.05

Test statistics =(x-μ)/(σ/√n)=(125-126.7036)/(12.8836/√27)=-1.7037/2.4794=-0.6871

Test statistic =|z|=0.6871

Critical value =Z_(α/2)=1.645

Conclusion: Since the test statistic is less than the critical, we fail to reject the null hypothesis because there is not enough evidence to support the claim that the meantime of 27 people exercising is more than 125 minutes each week.