Analyzing the number of lung cancer deaths
Here we will indicate the variable data types, create frequency tables and come up with tables to show the level of deaths as a result of lung cancer.
Task
The dataset you are using for this assignment has information on lung cancer deaths by age and smoking status (BST571_GradedAssignment1_Data). The data is already an SPSS dataset, so just double-click on the data, and it will open in SPSS.
Codebook for the data:
| Variable | Description |
| ID | ID Variable |
| agegrp | Age Groups: 1 = 40 – 49 years, 2 = 50 – 59 years, 3 = 60 – 69 years, 4 = 70+ years |
| smoking | Smoking Status: 0 = Does Not Smoke, 1 = Smokes Cigars, Pipes, or Cigarettes |
| pop | Population – In Hundred Thousands |
| deaths | Number of Lung Cancer Deaths in a Year |
1. Fill out the table below, indicating the variable type for each variable in the dataset (nominal, ordinal, or numerical):
| Variable | Type |
| agegrp | Ordinal |
| smoking | Nominal |
| pop | Numerical |
| deaths | Numerical |
2. Use SPSS to create frequency tables of agegrp and smoking. From the frequency tables, answer the following:
a. What percentage of patients were aged 60 – 69 years old?
Ans: 36.11%
b. What percentage of patients smoke?
Ans: 25%
c. How many patients are 70 years old or older?
Ans: 19.44%
3. Use SPSS to create descriptive tables of pop and deaths. From the descriptive tables, answer the following:
a. What are the mean and standard deviation for pop?
Ans: Mean = 1558.9444
SD = 1562.23217
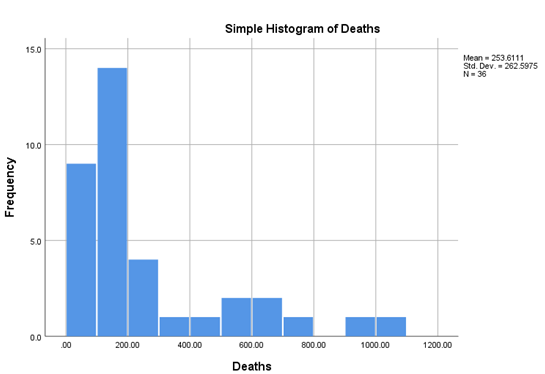
b. What are the mean and standard deviation for deaths?
Ans: Mean = 253.6111
SD = 262.5975
c. What is the largest deaths value?
Ans: 1001
4. Create a histogram of deaths. Copy and paste the histogram below:
Ans:
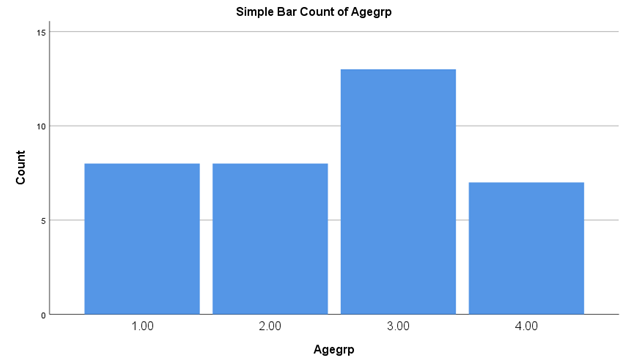
5. Create a bar graph of agegrp. Copy and paste the bar graph below:
Ans: