Significance Testing and ANOVA
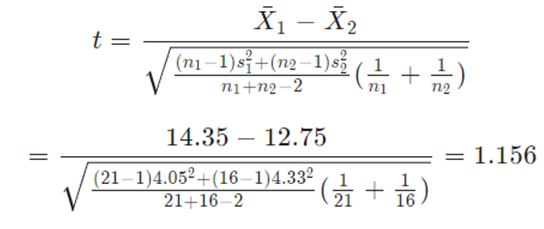
1. A local Thai restaurant wants to compare the popularity of two different chicken dishes that it offers daily by having a test in which each dish is tasted and then rated. Random samples of 21 people who taste the Red Curry dish give it a mean score of 14.35 points with a standard deviation of 4.05 points. Random samples of 16 people who taste the Green Curry dish give it a mean score of 12.75 points with a standard deviation of 4.33 points.
a. Assuming equal population standard deviations use the 0.05 level of significance to test if the Red Chicken Curry and the Green Chicken Curry are equally popular.
b. In part (a) of this problem, we made the assumption of equal population standard deviations. At the 0.05 level of significance, test whether this assumption is correct.
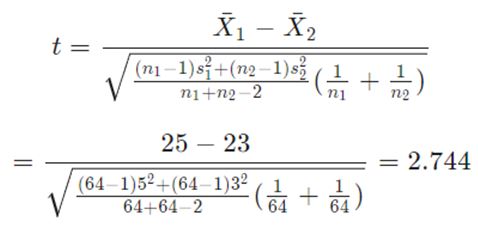
2. A carrot farmer wants to compare two brands of fertilizer in terms of greater crop yield. He uses a new brand of fertilizer in a plot of 64 square feet and harvests an average of 25 pounds of carrots per square foot, with a standard deviation of 5 pounds. He uses the regular brand of fertilizer in a plot of another 64 square feet and harvests an average of 23 pounds of carrots per square foot, with a standard deviation of 3 pounds.
At a significance level of 0.05, can the farmer conclude that the new brand of fertilizer is better than the regular fertilizer in terms of greater yield?
3. A high school advisor will recommend the Sylvan Tutoring Center to advisees if she finds that students score better in a comprehensive science exam after they have completed the course. She sets up an experiment in which a random sample of 7 students takes the science exam twice: once before and then again after they take the tutorial course. The results are shown below:
| Student | Pre Tutoring Score | Post Tutoring Score |
| 1 | 75 | 77 |
| 2 | 78 | 79 |
| 3 | 72 | 74 |
| 4 | 86 | 89 |
| 5 | 83 | 86 |
| 6 | 79 | 78 |
| 7 | 67 | 70 |
At the 0.05 significance level, should the advisor recommend the Sylvan Tutoring Center to her students?
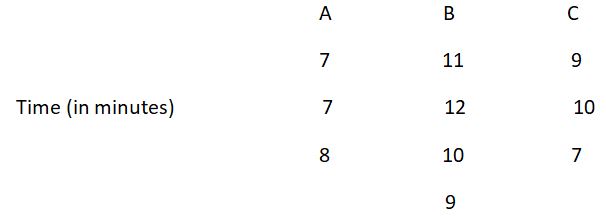
4. A large car service shop wants to determine if 3 different training techniques (A, B, and C) are equally effective in teaching its mechanics to install a new filtration system in cars. A group of mechanics is randomly assigned to be trained in one of the 3 techniques and then tested to see how long it takes them to install the new filtration system. The recorded times are given below:
Technique
a. (i) in this experiment, what is the independent variable?
(ii) What is the dependent variable?
(iii) Is this a balanced experiment? Why or why not?
b. Conduct a one-way ANOVA test to determine if the 3 techniques are equally effective in teaching the mechanics to install the new filtration system in cars. Use α= 0.05.
Solution:
Q1)
Red Curry: N1 = 21; Mean = 14.35; SD = 4.05
Green Curry: N2 = 16; Mean = 12.75; SD = 4.33
(a)
We need to test if the scores of Red Curry and Green Curry are equal, assuming that the two population standard deviations are equal
We can use the independent samples t-test to test the hypothesis
Null hypothesis: average scores of Red Curry and Green Curry are equal
Alternate hypothesis: average scores of Red Curry and Green Curry are not equal
Degrees of freedom = N1 + N2 – 2 = 35
Critical values of t statistic, df = 35, at 0.05 significance level are -2.03 and 2.03
As the value of t-statistic is within the critical values of t-statistic, we fail to reject the null hypothesis.
Thus, we conclude that the average scores of Red Curry and Green Curry are equal.
(b)
We can test the assumption of equal population standard deviation using F-test
Null hypothesis: variances of scores of Red Curry and Green Curry are equal
Alternate hypothesis: variances of scores of Red Curry and Green Curry are not equal
The F-test can be used to test the hypotheses
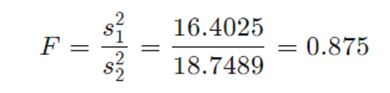
The critical values of F-statistic at 0.05 significance level, are 0.389 and 2.756
The test value of F-statistic is between the critical values of F-statistic. Therefore, we fail to reject the null hypothesis and conclude that the variances of scores of Red Curry and Green Curry are equal
Q2)
Regular fertilizer: N1 = 64; Mean = 25; SD = 5
New brand: N2 = 64; Mean = 23; SD = 3
Null hypothesis: average yield of regular fertilizer is less than or equal to that of new fertilizer
Alternate hypothesis: average yield of regular fertilizer is greater than that of new fertilizer
The independent samples t-test can be used to test the hypothesis
Degrees of freedom = N1 + N2 – 2 = 126
The critical value of t statistic, df = 126, at 0.05 significance level is 1.657
As the value of t-statistic is greater than the critical value of t-statistic, we reject the null hypothesis.
Thus, we conclude that the average yield of regular fertilizer is greater than that of new fertilizer
Q3)
Null hypothesis: average difference of post tutoring scores and pre tutoring scores is less than or equal to zero
Alternate hypothesis: average difference of post tutoring scores and pre tutoring scores is greater than zero
The paired samples t-test can be used to test the hypothesis
The average difference between post tutoring scores and pre tutoring scores is equal to 1.86
The average standard deviation of the difference of scores is 1.463
T-statistic = (1.86 – 0)/(1.463/sqrt(7)) = 3.3566
Critical value of t-statistic, df = 6, at 0.05 significance level is 1.943.
The test value of t-statistic is greater than the critical value of t-statistic. Therefore, we reject the null hypothesis and conclude that the average difference between post tutoring scores and pre tutoring scores is greater than zero. The advisor should recommend the Sylvan Tutoring Center to her students.
Q4)
(a)
(i)
The independent variable is the type of training technique used
(ii)
The dependent variable is the time taken to install the filtration system
(iii)
The experiment is not a balanced experiment as the number of observations in each group is not equal to zero.
(b)
Null hypothesis: average time taken to install the new filtration system is equal for all the three training techniques
Alternate hypothesis: average time taken to install the new filtration system is different for at least one of the three training techniques from the others.
Dfbetween = 2
Dfwithin = 7
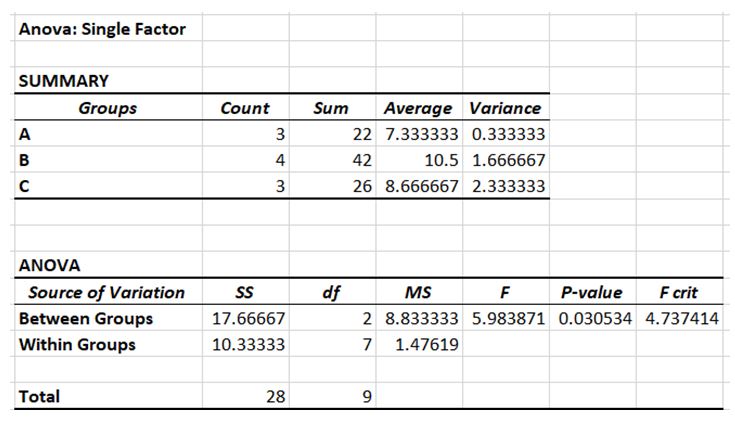
The test value of F-statistic is 5.98, while the critical value of F-statistic is 4.737. Thus, 0.05 significance level, we reject the null hypothesis and conclude that the 3 training techniques are not equally effective in teaching the mechanics to install the new filtration system.