Z-Test and T-Test for Sample Mean
Problem A: Z-test for a sample Mean (M) verses a population Mean (μ).
Answer question 1 to 5 based on the following information:
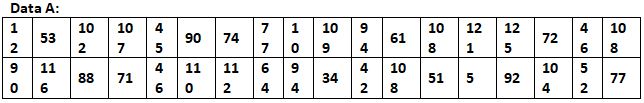
The average magnesium concentration in ground water around Metro City μ = 88.0-parts per million (ppm) with a standard deviation of σ = 10. The table below shows the ground-water magnesium concentrations (ppm) from random sites in a suburb located 15 miles away. At α = .01, can it be concluded that the average magnesium concentration in the suburb differs from a population mean of 88.0 ppm?
Q1. State the null (H0) and alternative (H1) hypotheses. Both must be correct
Null hypothesis, H0: Average magnesium concentration in the ground waters of the suburbs is equal to 88.0 ppm
Alternative hypothesis, H1: Average magnesium concentration in the ground waters of the suburbs is not equal to 88.0 ppm
Q2. Find the critical values.
As the population standard deviation is known, we will use the one sample Z-test to test the hypothesis.
The critical values of Z-statistic at 0.01 level of significance are -2.5758, 2.5758
Q3. Compute the test statistic. (Report answer to 2 decimal places)
Sample mean = 76.944 ppm
Z-statistic = (Sample mean – Population mean)/(Population standard deviation/SQRT(Sample Size))
Z-statistic = (76.944 – 88)/(10/SQRT(36))
Z-statistic = -6.633
Q4. Do you accept or reject H0.
As the test value of Z-statistic lies beyond the range of critical values, we reject the null hypothesis
Q5. Summarize the results. Be sure to explain if the concentrations differ significantly, and if so, how?
Samples of ground water were collected from the suburbs of Metro City, to test if the magnesium concentration in the water significantly differed from the magnesium concentrations in the City. The sample average of magnesium concentration in the ground water samples collected from the suburbs is equal to 76.944 ppm. The Z-statistic is equal to -6.633. Thus, at 0.01 significance level, we reject the null hypothesis and conclude that the average magnesium concentration in the ground waters of the suburbs is not equal to 88.0 ppm.
Problem B: t-test for a sample Mean (M) verses a population Mean (μ).
Answer questions 6 to 10 based on the following information:
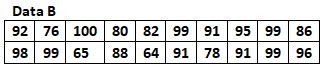
Professor Sandy Smith hypothesizes that her is current class of statistics students is far superior to previous classes. She bases her assertation on the performance these students on a final exam. The mean final exam grade for previous classes is (μ = ) 70.0. Using the data below, test to see if Professor Smith’s current class is indeed significantly better at Statistics than previous classes. Set α = .05.
Q6. State the null (H0) and alternative (H1) hypotheses. Both must be correct
Null hypothesis, H0: The average final exam grade of current class of statistics students is less than or equal to 70
Alternate hypothesis, H1: The average final exam grade of current class of statistics students is greater than 70.
Q7. What are the df and t-critical value (Both must be correct)
Df = N -1 = 19
Critical value of t = 1.729
Q8. Compute the test statistic. (Report answer to 2 decimal places)
t-statistic = (Sample mean – Population mean)/(Sample standard deviation/SQRT(Sample Size))
t-statistic = (88.45 – 70)/(11.08092/SQRT(20))
t-statistic = 7.446
Q9. Do you accept or reject H0?
As the test value of t-statistic lies is greater than the critical value, we reject the null hypothesis
Q10. Summarize the results, be sure to indicated whether Prof Smith’s hypothesis is true or false.
Prof Smith wanted to test if the average final exam grade for the current class of statistics was greater than the previous classes. The sample average final exam grade is 88.45, The t-statistic is equal to 7.446. Thus, at 0.05 significance level, we reject the null hypothesis and conclude that the average final exam grade for the current class of statistics was greater than the previous classes.
Problem C. Z-test for a Proportion
Answer questions 11 to 15 based on the following information:
According to the Skin Cancer Association of America, 1 in 5 (.200, or 20%) Americans will develop skin cancer in their adult lives. Dr. Spock, the medical director of the Miami Cancer Treatment Center, believes that the prevalence of skin cancer among Miami-Dade County residents is higher than this National average. To test his hypothesis, he collects medical records for a random sample of 500 adults (people over the age of 50) that reside in Miami-Dada County. Within this sample 190 people had tested positive for skin cancer. Test to see if Dr. Spock’s hypothesis is true. Set α = .01
Q11. State the null (H0) and alternative (H1) hypotheses. Both must be correct
Null hypothesis, H0: The prevalence of skin cancer among Miami-Dade County residents is less than or equal to the national average
Alternate hypothesis, H1:The prevalence of skin cancer among Miami-Dade County residents is greater than the national average
Q12. Find the critical value
The critical value is equal to 2.326
Q13. Compute the test statistic. (Report answer to 2 decimal places)
Sample proportion of adults who are positive for skin cancer = 190/500 = 0.38
Z-statistic = (Sample proportion – National proportion)/SQRT(National proportion*(1-National proportion)/N))
Z-statistic = (0.38 – 0.2)/SQRT(0.2*0.8/500) = 10.0623
Q14. Do you accept or reject H0?
As the Z-statistic is greater than the critical value, we reject the null hypothesis
Q15. Summarize the results, be sure to indicated whether the rate of skin cancer in Miami-Date County is significantly above the national average.
Dr. Spock wanted to test if the prevalence of skin cancer among Miami-Dade County residents is greater than the national average. The sample proportion is equal to 0.38, Z-statistic is equal to 10.0623. Thus, at 0.05 significance level, we reject the null hypothesis and conclude that the prevalence of skin cancer among Miami-Dade County residents is greater than the national average
Problem D: Chi-square (χ2) test for standard deviation
Answer questions 16 to 20 based on the following information:
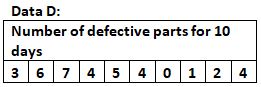
Wendy Weeks, the Quality Control Manager at the Widgets Manufacturing Company believe that a newly implemented parts assembly procedure produces fewer defective parts. She knows from yeas of data that the daily standard deviation for defective parts is (σ =) 10. To test to see if the new assembly procedure produced a lower standard deviation, the manager obtains daily defective parts data for that past two week – 10 days. Using the data below, test to see if the standard deviation for the new assembly procedure differs significantly from a standard deviation of (σ =)10.
Q16. State the null (H0) and alternative (H1) hypotheses. Both must be correct
Null hypothesis, H0: The variance for defective parts produced from the new assembly procedure is greater than or equal to the variance of defective parts produced from the old assembly procedure
Alternate hypothesis, H1: The variance for defective parts produced from the new assembly procedure is greater than or equal to the variance of defective parts produced from the old assembly procedure
The chi-square test for one population variance will be used to test the hypothesis
Q17. What are the df and χ2-critical value (Both must be correct)
Df = 9
At 0.05 significance level, the critical value of χ2statistic is equal to 3.325
Q18. Compute the test statistic. (Report answer to 2 decimal places)
Sample variance = 4.71
χ2= (N – 1)*(Sample variance)/(Population variance) = 9*4.71/100 = 0.424
Q19. Do you accept or reject H0?
As the test value of χ2is less than the critical value of χ2, we reject the null hypothesis.
Q20. Summarize the results, and be sure to indicated whether the new production process produces a different standard deviation that the old manufacturing process. And is that a good or bad thing from the company’s point of view?
Wendy Weeks wanted to test if the variance for defective parts produced from the new assembly procedure is greater than or equal to the variance of defective parts produced from the old assembly procedure. The sample variance is equal to 4.71. The test value of χ2 is equal to 0.424. Thus, at 0.05 significance level, we reject the null hypothesis and conclude that the standard deviation for defective parts produced from the new assembly procedure is greater than or equal to the standard deviation of defective parts produced from the old assembly procedure.