Sample Sizes and Hypothesis Testing
The solutions posted here are mainly based on sample size and hypothesis testing concepts. Others state and test hypotheses based on the type of study being undertaken. There are also a few correct calculations with step-by-step development of the solution that can help you easily learn.
Finding the Z-Score
1. You are up for a promotion at your work and you know that you needed to get at least 24.6 sales exactly this month to be set for the promotion. The average number of sales in your store was 24 with a standard deviation of 2 and a normal distribution. Based on this distribution what would be the likelihood you will be getting your promotion? Make sure to show and explain your work. Credit is given both for getting the right answer as well as showing the steps that led you there.
Please provide a brief verbal interpretation for the Z-score of the minimum number of sales you would need.
Ans: Here to get at least 24.6, the Z-score should be at least Z=(24.6-24)/2=0.3. Thus, I need to at least get 0.3*= time standard deviation more sales than the average sales which are 24.
Now, we need to find the likelihood of this event which is similar to finding the probability P(Z≥0.3)=0.382. Thus, the required probability is 0.382
Sample Size
2. We are interested in examining scores on tests of academic achievement for a group of third-graders at a nearby school in social studies. The hope is we can take a sample of these students’ scores and generalize them to third graders in the entire state.
What sample size might be better and why- 3 or 300?
For the above problem, if the overall score of the class is an average of 30, what is the probability that in a random sample of 17 students the score will be above 40? Show your work and clearly label where each number is coming from.
Ans: i) The more the sample size, the better the inferences about the population can be made. Hence, we should take a sample size of 300.
ii) Here we know that the population average is 30. Now, we have a sample of 17 students. The, sample average will have an expectation of 30. Now, we want to find the probability that the average of the sample is greater than 40. Then, the probability is given by:
P(X ̅>40)=P((X ̅-30)/(σ/√n)=(40-30)/(σ/√n))=P(Z>(10√17)/σ). Here n is the sample size and the population standard deviation is not known. Thus, the numerical value of probability can’t be given.
Hypothesis Testing
3. Propose an example study that you might be interested in completing. After explaining how you might go about collecting data completing this study, write down the null hypothesis and alternative hypothesis. Please explain why these two hypotheses are different and what it would mean to reject the null.
Ans: I’m interested in finding if there is any correlation between the height of a student and their grades. For this, I’ll randomly select students. The random selection can be done by giving numbers of students from 1 to whatever the total number of students in the university. And then randomly pick 50 numbers, then accordingly I’ll ask the selected students about their height and grades.
Here the null and Alternative hypotheses are:
Null hypothesis: There is no correlation between student height and grade
Alternative hypothesis: There is a correlation between student height and grade.
The two hypotheses are different as one says that there is no correlation between the two variables while the other one is saying that there is a correlation between the variables.
Rejecting the null will mean that we don’t have sufficient evidence to support the claim that there is no correlation between student height and grade.
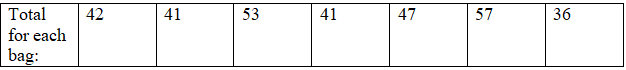
4. You are working at a sandwich shop and recently became the owner. You want to make sure that the company you are buying bread form is sending the appropriate number of bread rolls that you build your sandwiches with. The concern you have is that if you are receiving too few you are not getting bread that you need for sandwiches but too much and it will spoil. In looking at the company’s website they state that bags of bread rolls on average have 50 rolls and, through some digging on your own by calling the suppliers, you figure out that the standard deviation is 5. You grab 7 unopened bread roll bags that came in on the latest shipment. You are to find out if there are any concerns with regard to the number of rolls you are getting (significance of .05). See below for a table that displays the number of rolls in each bag:
What is the null and alternative hypothesis?
Ans: Null Hypothesis: μ=50. Where μ is the population means of the number of bread rolls.
Alternative hypothesis: μ≠50
If you run the calculations, what do you find out? Make sure to show your work. Did you reject the null and if so/not, why?
Ans: To test the hypothesis we need to run a one-sample Z-test. The test statistic is given by Z=(x ̅-50)/(σ/√n). Here the sample mean is x ̅=(42+41+53+41+47+57+36)/7=45.286
Thus, the test statistic is Z=(45.286-50)/(5/√17)=-3.887. The test statistic is less than the critical value which is -1.96. Thus, we reject the null hypothesis.
Use the numbers provided in the example (regardless of what you have determined up until this point for this question [i.e., regardless of previous answers]). Calculate Cohen’s d and provide an interpretation (if it is less than “small” based upon your calculation say this and describe why you got that/what this might mean for statistical significance).
Ans: Cohen’s d=|(x ̅-50)/σ|=|(45.286-50)/5|=0.9428. This number is greater than 0.8, thus we can say that the effect is large. Hence, we can say that the number of bread rolls is very low compared to the average.
5) In looking at different effect sizes, what might it mean if a difference between two groups is statistically significant but the effect size is small? If you were on a working committee looking at two different treatment methods for an anxiety disorder and you found these results, what might you talk about with your colleagues?
Ans: Even when the difference between the two groups is statistically significant the effect small size is small, meaning that the difference between the two groups is negligible.
If I were in a committee, then I would suggest my colleagues