Different treatment types test with Small sample
| Treatment | Depression Score (Lower is more Favorable) |
| CBT | 12 |
| CBT | 12 |
| CBT | 13 |
| CBT | 10 |
| CBT | 9 |
| CBT | 13 |
| CBT | 12 |
| CBT | 18 |
| CBT | 14 |
| CBT | 12 |
| CBT | 13 |
| CBT | 14 |
| CBT | 10 |
| CBT | 13 |
| CBT | 12 |
| Psychoanalysis | 17 |
| Psychoanalysis | 15 |
| Psychoanalysis | 26 |
| Psychoanalysis | 13 |
| Psychoanalysis | 14 |
| Psychoanalysis | 17 |
| Psychoanalysis | 16 |
| Psychoanalysis | 18 |
| Psychoanalysis | 12 |
| Psychoanalysis | 18 |
| Psychoanalysis | 13 |
| Psychoanalysis | 18 |
| Psychoanalysis | 15 |
| Psychoanalysis | 16 |
| Psychoanalysis | 16 |
The above data set was obtained from a sample of 30 patients being treated (with either CBT – Cognitive Behavioral Therapy or Psychoanalysis) for a mood disorder. Their depression scores (following treatment) are reported. Manually perform the independent samples t-test in order to determine which treatment is more effective.
REQUIRED:
All formulas and calculations (Mean, SD, pooled variance, SE of the difference, t-value, etc.) must be shown (to two decimal places).
Please organize your work as follows:
- Write the research objective
- Identify the variables and type of data
- State the null hypothesis
- State the alternative hypothesis
- State the alpha level
- State the statistical test (and justification)
- Perform the manual calculations
- Interpret the outcome of the manual calculations: Compare the t-calculated and t-critical values, and determine whether to reject or accept the null hypothesis
- Perform the analysis with SPSS, and write a brief conclusion using the attached format (both text and table, including title and footnote).(both text and table, including title and footnote).
Solution:
1. Write the research objective
The research is aimed at finding if the depression levels of the patients differ based on the treatment given to them for a mood disorder. The sample comprises 30 patients where 15 patients are treated with CBT while the other 15 patients are treated with psychoanalysis.
2. Identify the variables and type of data
The dependent variable is the depression score, which is a scale variable while the independent variable is the treatment for a mood disorder which is a binary variable where it is coded as 1 if the treatment is CBT and it is coded as 2 if the treatment is psychoanalysis. It is a nominal variable.
3. State the null hypothesis
The null hypothesis states that there is no difference in the depression scores based on the treatment given to the patients for a mood disorder.
4. State the alternative hypothesis
The alternate hypothesis states that there is a difference in the depression scores based on the treatment given to the patients for a mood disorder.
5. State the alpha level
5% alpha level is used.
6. State the statistical test (and justification)
Since the dependent variable used is the scale variable while the independent variable is a nominal variable with two categories and the two samples are independent of one another, we will be using independent samples t-test.
7. Perform the manual calculations
Mean of 15 patients with CBT treatment = ΣDepression score of all the 15 patients/count
= 187/15 = 12.47
Mean of 15 patients with psychoanalysis treatment = ΣDepression score of all the 15 patients/count
= 244/15 = 16.27
SD of 15 patients with CBT treatment =sqrt(sum(xi-μ)2)/(N-1) = sqrt(61.7335/14) = sqrt(4.41) = 2.10
SD of 15 patients with psychoanalysis treatment =sqrt(sum(xi-μ)2)/(N-1) = sqrt(152.9335/14) = sqrt(10.92) = 3.31
SS of 15 patients with CBT treatment =(sum(xi)2) – (sum xi2)/N = 2393-2331.27 = 61.73
SS of 15 patients with psychoanalysis treatment =(sum(xi)2) – (sum xi2)/N = 4122-3969.067 = 152.93
Pooled variance = SS1+SS2/(N1+N2-2) = 61.73+152.93/15+15-2 = 7.67
SE of the difference = [sqrt (pooled variance)*(1/N1 + 1/N2)] = sqrt(7.67*(0.0667+0.0667)) = sqrt (1.022) = 1.01
Mean Dufference – Mean1- Mean2 = 12.47-16.27 = -3.8
t-stat = Mean difference/SE of difference = -3.8/1.01 = -3.76
8. Interpret the outcome of the manual calculations: Compare the t-calculated and t-critical values, and determine whether to reject or accept the null hypothesis
The critical value of t at 28 degrees of freedom at 5% alpha level = +/- 2.05
The computed value of t-stat at -3.76 is larger than the critical value at -2.05 at the 5% alpha level. Thus, we reject the null hypothesis.
9. Perform the analysis with SPSS, and write a brief conclusion using the attached format (both text and table, including title and footnote).
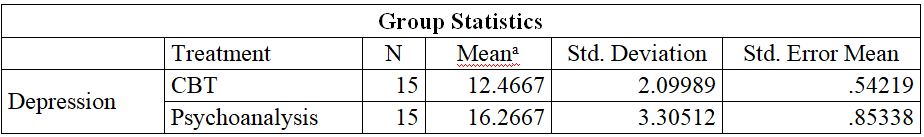
a. t(28)= -3.58, p=0.00
Since the level of significance (.31) for Levene’s test is greater than alpha (.05), we can conclude that the assumption of homogeneity of variance is met. In other words, the variances are equal.
Given that the level of significance (.00) for the t-test is less than alpha (.05), we must reject the null hypothesis, and conclude that there is a statistically significant difference between the two groups.
That is, the depression scores of patients who were treated with psychoanalysis treatment (M = 16.27, SD =3.31) were higher than those who were treated with CBT (M = 12.47, SD = 2.10), on average.