Problem Description:
The R Programming homework involves analyzing the relationship between voters' preferences for the 2016 U.S. presidential election and several independent variables. The dependent variable is "For whom did R vote for President," and the independent variables include:
- "Does R favor or oppose government reducing income inequality."
- "How much discrimination has R faced personally."
- "How often does R pay attention to politics and elections."
The goal is to understand how these independent variables might influence voters' choices in the 2016 presidential election.
Solution
Variables
- Dependent: V162034a - For whom did R vote for President
- Independent:
V162148 - Does R favor or oppose govt reducing income inequality
- This is more of a Bernie Sanders campaign strategy, so this may influence Democrat’s voter turnout (in favor selecting Clinton).
V162367 - How much discrimination has R faced personal
- Among the 3 top candidates for Presidency, Trump may be the most vocal about his stand towards multiracial Americans, or other races in general. Thus, R’s answer to this may be correlated with R’s choice of president (selecting anyone other than Trump).
V161003 - How often does R pay attn to politics and elections
- This may be an objective approach to selecting the president, although, it may also just be an indication of R’s biasedness towards a certain candidate. Either way, it may be interesting to know who these Rs prefer the most (equal voter turnout for the top 3).
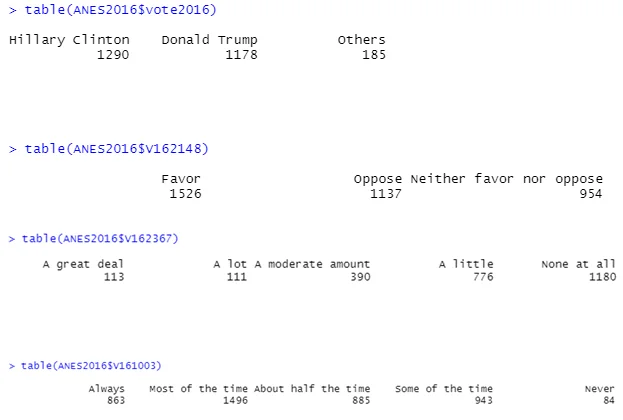
Frequency Tables
Crosstables
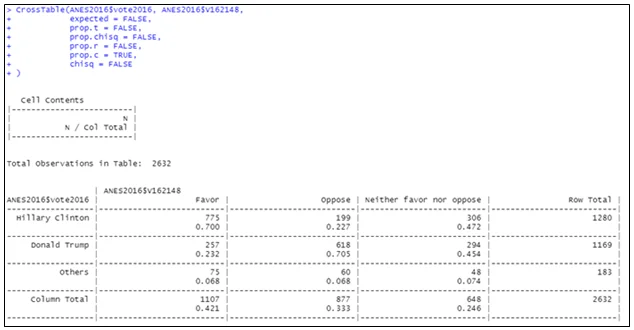
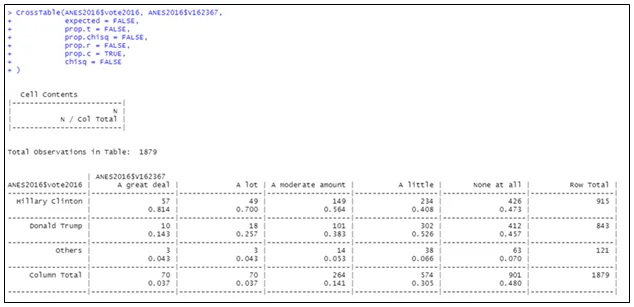
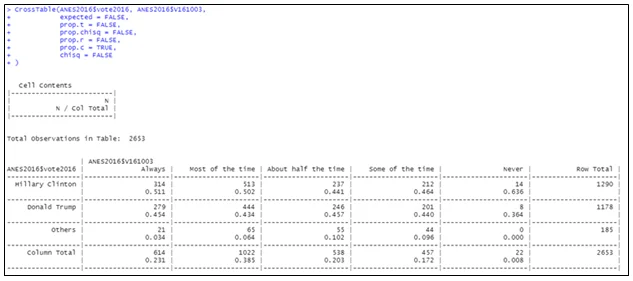
If you are in favor of reducing income inequality by the government, then you are more likely to vote for Clinton (70%) compared to Trump (23.2%). If you faced a great deal of personal discrimination, you are more likely to vote for Clinton (81.4%) compared to Trump (14.3%). If you always paid attention to politics and election, you are more likely to vote for Clinton (51.1%) compared to Trump (45.4%). The first two results supported my hypotheses above while the last one is a bit inclined to Clinton (although they are very close to breakeven).
library(haven)
ANES2016 <- read_stata("C:/Users/USER/Downloads/ordernumbershh5063/Lab 3 Dataset")
#recode some responses (<0) to NA
ANES2016$vote2016 <- ANES2016$V162034a
ANES2016$vote2016 <- replace(ANES2016$vote2016, ANES2016$vote2016 < 0,NA )
ANES2016$vote2016 <- replace(ANES2016$vote2016, ANES2016$vote2016== 7,NA )
ANES2016$vote2016 <- replace(ANES2016$vote2016, ANES2016$vote2016== 9,NA )
ANES2016$vote2016 <- replace(ANES2016$vote2016, ANES2016$vote2016== 4, 3 )
ANES2016$vote2016 <- replace(ANES2016$vote2016, ANES2016$vote2016== 5, 3 )
ANES2016$V162148 <- replace(ANES2016$V162148, ANES2016$V162148 < 0,NA )
ANES2016$V162367 <- replace(ANES2016$V162367, ANES2016$V162367 < 0,NA )
#adding labels
ANES2016$vote2016 <- factor(ANES2016$vote2016,
levels = c(1,2,3),
labels = c("Hillary Clinton", "Donald Trump", "Others"))
ANES2016$V162148 <- factor(ANES2016$V162148,
levels = c(1,2,3),
labels = c("Favor", "Oppose",
"Neither favor nor oppose"))
ANES2016$V162367 <- factor(ANES2016$V162367,
levels = c(1,2,3,4,5),
labels = c("A great deal",
"A lot", "A moderate amount",
"A little", "None at all"))
ANES2016$V161003 <- factor(ANES2016$V161003,
levels = c(1,2,3,4,5),
labels = c("Always",
"Most of the time", "About half the time",
"Some of the time", "Never"))
#creating tables for all variables
table(ANES2016$vote2016)
table(ANES2016$V162148)
table(ANES2016$V162367)
table(ANES2016$V161003)
#creating crosstables
library(crosstable)
CrossTable(ANES2016$vote2016, ANES2016$V162148,
expected = FALSE,
prop.t = FALSE,
prop.chisq = FALSE,
prop.r = FALSE,
prop.c = TRUE,
chisq = FALSE
)
CrossTable(ANES2016$vote2016, ANES2016$V162367,
expected = FALSE,
prop.t = FALSE,
prop.chisq = FALSE,
prop.r = FALSE,
prop.c = TRUE,
chisq = FALSE
)
CrossTable(ANES2016$vote2016, ANES2016$V161003,
expected = FALSE,
prop.t = FALSE,
prop.chisq = FALSE,
prop.r = FALSE,
prop.c = TRUE,
chisq = FALSE
)