Problem Description:
This statistical analysis homework explores the connection between distress levels and Fmri_ACC activity, focusing on the hypothesis that distress and Fmri_ACC are positively correlated. The dataset contains data from individuals reporting their levels of social distress, and Fmri_ACC activity levels were measured. The analysis aims to determine if there is a significant relationship between these two variables.
Solution
(a) Scatter plot
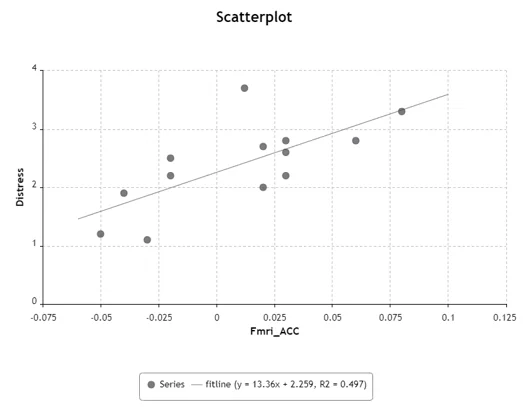
The scatter plot above reveals that there is a positive relationship between distress and Fmri_ACC. This means an increase distress associated with an increase in Fmri_ACC and vice versa.
(b) Correlation coefficient
A.
- H0: There is no correlation between distress and Fmri_ACC (ρ=0)
- Ha: There exist correlation between distress and Fmri_ACC (ρ≠0)
B.
Bivariate Correlations
Pearson Correlations
Distress
| Correlations | Distress | Fmri_ACC |
| r | 1 | 0.7047 |
| t | 3.2943 | |
| p(2-tailed) | 0.007 | |
| valid n | 13 |
Fmri_ACC
| Correlations | Distress | Fmri_ACC |
| r | 0.7047 | 1 |
| t | 3.2943 | |
| p(2-tailed) | 0.007 | |
| valid n | 13 |
tested against rho0 = 0
° adjust p by factor 0.5 for directional hypothesis
The statistics that are important to note here are the correlation coefficient (r), t statistic (t) and the p -value .
C. The p level from this output is 0.007
D. Yes, Since the p-value (0.007) is less than the significance level (α = 0.05), we reject the null hypothesis and conclude that there is a significant correlation between distress and Fmri_ACC
E. The result shows that the activity in the anterior cingulate cortex and those with self-reported social distress levels are correlated. They have a direct relationship.
F. Actually, linear regression could be used to further analyze this data set, the relationship between the two variables as measured by the correlation can be established using linear regression analysis. It will also reveal the magnitude of change in one variable as a result of a unit increase in the other variable.
1. Provide a synopsis of the study including the purpose and the variables being studied.
This research seeks to investigate the relationship between hypertension defined on the basis of automated office (AO)BP with a threshold of 135/85 mmHg and office, home or ambulatory blood pressure (BP) with a threshold of 130/80 mmHg. Regression analysis was utilized to examine this relationship with and without control for age and sex for 514 untreated patients was considered in the study whose AOBP readings and 24‐hour ambulatory BP recordings were obtained.
The study recommend the use of AOBP as the method of choice for determining blood pressure in routine clinical practice, regardless of which of the two thresholds is used to diagnose hypertension,135/85. AOBP in mmHg is slightly closer to the corresponding value. For awake ambulatory blood pressure.
2. Are summary statistics of every variable provided?
Yes, summary statistics was provided for all the variables in the study as presented in Table
3. Are the model specifications discussed?
Yes, the model was actually specified in the study. The researcher used linear ordinary least squares regression models to estimate separately and combined for each group, in which ABP was regressed on AOBP alone and latter adjusted for age and gender.
4. Does the author discuss the analyses to suggest the assumptions of regression analysis were not violated?
Unfortunately, the researcher did not made mention on the violation of the assumptions of regression analysis.
5. Do the results make sense?
Since the violation of the assumptions of model used was not discussed, the results and conclusion from this study could be misleading as some violations are so serious to be neglected.