Regression and Hypothesis Testing Solutions
The solutions below involve fitting a multinomial logistic regression, interpreting the coefficients of age, and expressing the hypotheses, just to mention a few. Each solution has been clearly explained in simple terms to help you understand every concept underlying the questions.
Fitting a Multinomial Logistic Regression
Fit a multinomial logistic regression for the given data. Use the “excellent health" category as your reference. Is the model significant? Give a brief explanation of your answer.
Ans: Yes, the model I statistically significant. This is tested using the log-likelihood test which yields a significant result, χ^2=48.24, p <.001.
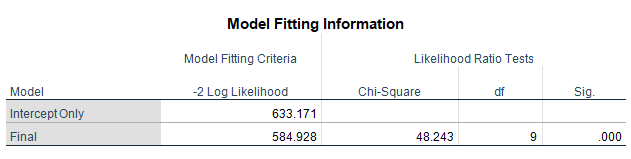
However, not all variables in the model were found to be statistically significant. Age and depressed variables were found to be statistically significant at a 5% level of significance, but the income was found to be insignificant.
Interpreting the Results
Interpret the coefficients for age, income, and depression for all the three model components (good, fair, or poor vs excellent health). What effect would an increase in the age of 10 years have on the odds of poor health? What effect would an increase in income of $5000 have on the odds of fair health? Illustrate all your calculations.
Ans:
The parameter estimates tell us the relationship between the dependent variables and predictors.
Age: Age has a positive coefficient for each of the good, fair, and poor health levels, with a statistically significant magnitude. This indicates that for each category of health (i.e., good, fair, or poor – vs Excellent health) comparison with excellent health, higher age leads to fewer odds of excellent health. E.g., age has a coefficient of 0.075 with health = 3 which means for each 1-year increase in age, the odds of having poor health increases by e^0.075=1.078 times from poor health.
Income: Income has an inconsistent relationship with the odds of having worse health than excellent. A good, and fair level of health, income has a negative relationship as higher income reduces chances of excellent health. In the poor health category, higher-income increases the odds of excellent health. However, income variable has been identified as the statistically insignificant variable.
Depressed: In depressed, 1 was taken as baseline. The coefficient of 0 is negative in all cases which indicates that having depression decreases the odds of excellent health. E.g., for health = 3, depression = 0 has a coefficient of -1.794 which means having depression decreases the odds of excellent health by factor e^(-1.794)= 0.166. Depressed was found to be statistically significant for fair or poor health but not for good health.
C. Which factors matter the most in identifying the differences among the levels of health statuses? Explain your answer in terms of p-values in individual models and by finding the overall variable significance. For one of the later tests, please express the hypotheses both mathematically and in words. Also, provide the test statistic. For the remaining tests, you may simply provide the p-values and write your conclusions.
Ans: The variables Age and Depressed are important in differentiating among the levels of health status.
For age, the hypothesis set up is as follows:
H_0:β_(age,1)=β_(age,2)=β_(age,3)=0;age is not a significant variable
vs
H_1:H_0 is false. Age is a significant differentiating variable.hypothesis regression 3
The test yields significant overall p-value of <.001 and significant individual p-values (health = 1 p <.001, health =2 p=.001, health = 3 p <.001).
The age is statistically significant for comparison of all categories with excellent health.
Similarly, depression is statistically significant overall with p=.023 but not for all categories. For poor health, p = .008; for fair health, p = .026; but for good health, p = .468. Hence, depression is the significant differentiating factor for fair and poor health.
Do the coefficients of all the significant variables differ across the three components of this model?
Yes. For the variables which were found to be significant, the coefficients were different.
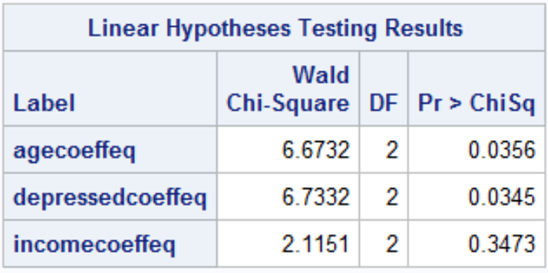
For the age variable, the hypothesis can be specified as below:
H_0:β_(age,1)=β_(age,2)=β_(age,3)
vs
H_1:H_0 is false.Coefficients are different.
The age variable yields a significant result, p = .0356 which is significant at a 5% level of significance.
Similarly, the depressed variable also yields a significant result, p=.0345.
Describing Relationships among Variables
Describe the relationships among all variables in this model with reference to your answers above.
Ans: The depression data were analyzed using the multinomial logistic regression where health was taken as a dependent variable and age, income, and depression as the independent variables. It was observed that age and depression are significant differentiating factors for differentiating excellent health categories from others but the income was insignificant. It was also observed that age and depression do not have the same coefficient across all health categories. The depression was decreasing the odds of excellent health for poor and fair health individuals but did not seem to have a significant effect on good health individuals whereas higher age was found to increase odds of excellent health.
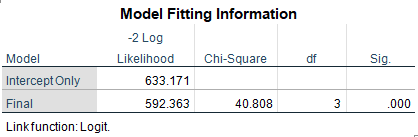
The health status outcome values have an ordering ignored by our multinomial logit model. Correct this by fitting an appropriate model using the same set of predictors used in (a)-(f). Is the model significant?
Ans: Yes, the model is significant as tested using the log-likelihood test, χ^2=40.8, p<.001
g. Interpret the coefficients of age, income, and depression and their corresponding odds ratios for the model in part (f). Which of them are significant predictors?
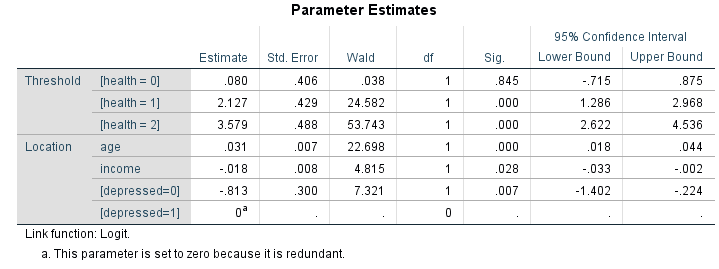
Ans: The parameter estimates tell us the relationship between the dependent variables and predictors. This time health = 3 has been taken as reference automatically.
Age: age has a positive overall coefficient (β=.031, p = .007) which is statistically significant indicating higher age increases the odds of poor health.
Income: Income is also significant this time with a negative coefficient (β=-0.018, p=.028) which indicates that higher income increases the odds of better health.
Depressed: In depressed, 1 was taken as baseline. The coefficient of 0 is negative and statistically significant (β=-0.813, p=.007) which indicates that having no depression decreases the odds of poor health.
h. Compare and contrast your results with those from the multinomial logistic model. Does one of the models fit better than the other? Elaborate on your answer.
Ans: The ordinal model fits the data better than the multinomial model as all the variables are statistically significant and give a consistent pattern. Although, in case-wise comparison, the multinomial model can be better. The income variable was insignificant in the multinomial model but it is explaining significant variation in the ordinal regression model.