Using Regression to Decide On the Hypothesis and Calculating the Coefficient of Determination
Question
A researcher wishes to understand how the university grade affects the wages that are earned by students taking the econometrics course at Brunel. In 2014 there were 97 students who passed the course. The researcher regressed their monthly wages in 2019 against their grade (where there are three dummies for grades A, B, and C), the age of the student, and their age-squared. The researcher estimated the following relationship (standard errors in parenthesis). Suppose the T SS = 35472 and the ESS = 9983.
Constant 1204 (208)
Grade A 815 (189)
Grade B 521 (174)
Grade C 206 (125)
Age 58 (22)
Age - squared 18 (8)
Explaining the dummy variable trap
(a) A critic argues that including a dummy of grade A, for grade B and grade C violates the dummy variable trap. Is the critic correct? Explain.
Yes, the critic is correct. The reason is that the Dummy variable trap is one of the crucial mistakes that machine learning engineers can make while they build their models. It affects the performance of the model and can lead to inefficiency in the model prediction. This means that one variable can be predicted from the others, making it difficult to interpret predicted coefficient variables in regression models. In other words, the individual effect of the dummy variables on the prediction model can not be interpreted well because of multicollinearity.
Marking significance levels
(b) Has the significance level been marked correctly in the table? Mark the significance level correctly in the table if this has not been done. [The answer must be written in the answer booklet].
| beta | Standard Error | T value | P-value | Sig/Not Sig | |
| Constant | 1204 | 208 | 5.788462 | 8.92108E-08 | Sig |
| Grade A | 815 | 189 | 4.312169 | 3.919E-05 | Sig |
| Grade B | 521 | 174 | 2.994253 | 0.003499021 | Sig |
| Grade C | 206 | 125 | 1.648 | 0.102621923 | Not Sig |
| Age | 58 | 22 | 2.636364 | 0.009773755 | Sig |
| Age Squared | 18 | 8 | 2.25 | 0.026732382 | Sig |
Making a decision on the hypothesis
(c) (i) Does the regression suggest that better grades raise wages? (Precisely explain what is being tested). (ii) Calculate the effect of being older by one year.
i. the regression suggests that better grades raise wages because the test is statistically significant as p < 0.05. Therefore, there is enough evidence to support the null hypothesis.
ii. the effect of being older by one year is given as
effect size = mean diff / standard error
=1/22=0.0454
An effect size of 0.05 is considered a small effect size. This means that if the difference of being older by one year is less than 0.05 standard deviations, the difference is negligible, even if it is statistically significant.
Calculating the coefficient of determination
(d) Calculate the R2 and test the overall significance of the model.
The coefficient of determination (R^2) is given as:
R^2=1-RSS/TSS
=1-9983/25472=0.7186
A coefficient of determination of 71.86% shows that 71.86% of the data fit the regression model. Hence, it is a good model.
Drawing a graph to represent the relationship
(e) Draw a graph to illustrate how the grade affects wages.
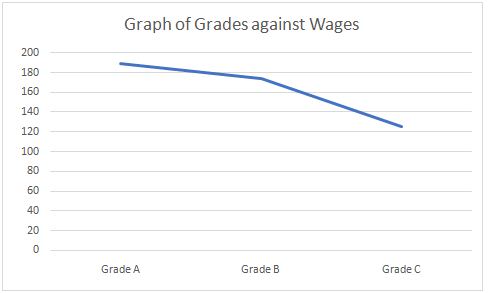
The graph above illustrates how grades (A, B, C) affect wages. The graph slopes downwards with Grade A having the largest impact followed by Grade B while Grade C has the least effect.