Performing R and comparing the results
Here, we run the R codes, identify the hypothesis and come up with a graph detailing the results of the research question.
Task
All relevant statistics and other information should be included in tables or graphs within this document.
A. Code included, and is organized and commented.
B. Code included importing data.
C. Code included to label factors.
D. Factors labeled correctly.
E. Code included generating tables, figures, and analyses.
F. Quality of the purpose of the study.
G. Purpose of study includes hypothesis/research questions for main effect and interaction.
H. Purpose of study contains research question(s).
I. Purpose of study contains the type of analysis with justification.
J. Results include descriptive statistics by game type (and possibly by ruminate). Must
include, Mean and sd.
K. Results are accurate.
L. Results are in APA style.
M. Results include a statement(s) about whether the null hypothesis was rejected or not.
N. Results include a description of effect sizes.
O. Discussion includes interpretation of results linked back to hypotheses and research
questions.
P. Discussion includes appropriate mention of limitations.
Q. Table with descriptive(s) by the group at end of the narrative.
R. Other graphs and tables included must be important, mentioned in the narrative, and related
to the argument.
S. Well written, with a logical flow. Free of extraneous arguments and unjustified claims.
Solution
A. Code included importing data
data<-read.csv("C:/Users/dell/Desktop/2021/aggression.csv")
data
B. Code included to label factors
For GameType
data$gameType<- factor(data$gameType,
levels = c(0,1),
labels = c("nonviolent", "violent"))
data$gameType
C. Code For Rumination Labels factors
data$ruminate<- factor(data$ruminate ,
levels = c(0,1),
labels = c("No", "Yes"))
data$ruminate
D. Histogram
hist(data$aggression)
Purpose of the study
There are theoretical grounds to believe they do, mainly if the game's violence is a source of obsession for the players. According to cognitive no linkage theory, rumination can keep aggressive thoughts, attitudes, and behavioral tendencies active in semantic memory over lengthy periods. It was determined how much behavioral hostility there was. We predicted the highest degrees of cognitive no association theory. To determine the main effects and interaction term effect, estimate the ANOVA test. Video games offer a platform for learning and practicing aggressive dispute resolution techniques. Playing violent video games seems to raise aggression. Ruminate impacts are also likely to be long-lasting; meanwhile, the participant learns and performs new aggression-related scripts that can develop progressively available as interval goes on.
Hypothesis
Ho: There is no relationship between game type and rumination levels of aggressiveness.
Ha: There is a relationship between game type and rumination levels of aggressiveness.
Ho: The main effect (game type) is not significantly related to aggression.
Ha: The main effect (game type) is significantly related to aggression.
Ho: The main effect (rumination) is not significantly related to aggression.
Ha: The main effect (rumination) is significantly related to aggression.
Ho: The interaction effect (rumination*gameType) is not significantly related to aggression.
Ha: The interaction effect (rumination*gameType) is significantly related to aggression.
Purpose of hypothesis
The relationship between trait anger and anger rumination was found to predict initial levels of aggressiveness (i.e., intercept) and changes in aggression over the game type and ruminant type (i.e., slope).
Research Question
Is the main or interaction effect are significant between aggression and rumination and game type?
Is there a relationship between ruminating to anger exhibit and relational aggression game type?
Type of analysis with justification.
Output
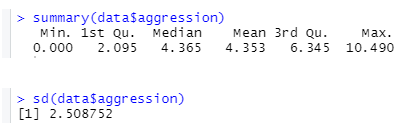
The above results showed the descriptive statistics of the variables. Also, describe its mean and standard deviation. The mean and the standard deviation for the variable aggression are (M = 4.353, SD = 2.5088).
Results
Figure 1
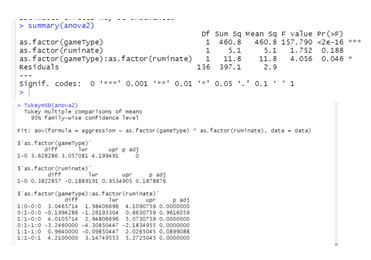
Violent games exhibited greater violence ratings than nonviolent games, according to a 2 (Game Type) x 2 (Rumination) ANOVA, F(1, 136) = 157.79, p=.0001. There were no other significant main or interaction effects. F(1, 136) = 1.752, p=0.188, that violent games had greater violence ratings than nonviolent games. Rumination has a large major effect.
Figure 2
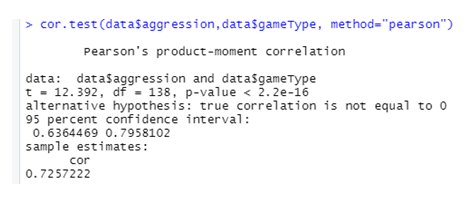
According to Pearson correlations, there was a significant positive link between variables (r(138) =.7257, p=0.000). This implies a positive relationship between aggression and game type. When the game-type values rise, the aggression levels tend to climb as well (move right).
Figure 3
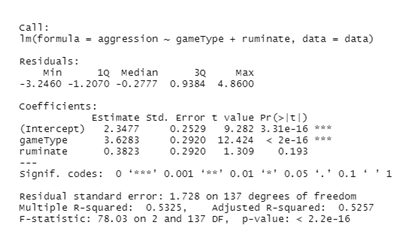
A linear regression analysis was used to see if aggression had any bearing on the game type and ruminate. The regression results showed that the model described the variation and statistically significant F(2, 137) = 78.03, p=.0000. Hence, the model is aggression =2.3477 +3.6283*game type + 0.3823*ruminate.
Graph and table
Figure 3
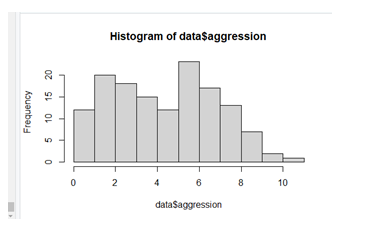
This pattern implies that many data points are higher than the mean, possibly outliers. As a result, the histogram plainly shows that it has a peak on the center, indicating that the aggression variable's distribution is approximately normal.