Instructions:
You will collect, analyze, categorize, and summarize qualitative data for this assignment.
Choose two magazines based on the same genre that either interest you. Choosing different types of magazines will make it difficult to do a comparative analysis. For both magazines, identify the cover page, title of the magazine, length of the page, article count, and the number of advertisements.
| Magazine 1 | Magazine 2 | |
| Title of magazine | Health | Shape |
| Cover price | 4.99$ | 4.99$ |
| Page length | 94 | 110 |
| Number of articles | 29 | 16 |
| Number of advertisements | 26 | 34 |
Analyzing and summarizing the data
The following steps show how the data collected above are analyzed and summarized. Tables, bar charts, and pie charts are used, with each visual representation explained clearly. Later, a wrap-up that elaborates how the process was conducted is given. The wrap-up contains the time taken, challenges met, and other things.
Categorizing Qualitative Data
| Magazine 1 | Magazine 2 | |||
| Category of Article (List) | Frequency | Relative Freq. | Frequency | Relative Freq. |
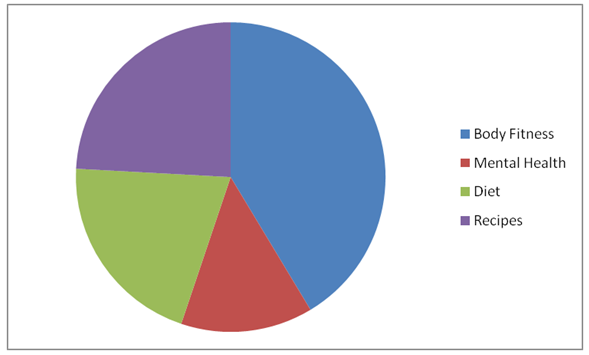
| Body Fitness | 12 | 0.4138 | 6 | 0.375 |
| Mental Health | 4 | 0.1379 | 3 | 0.1875 |
| Diet | 6 | 0.2609 | 3 | 0.1875 |
| Receipt | 7 | 0.2414 | 4 | 2500 |
Advertisement
| Magazine 1 | Magazine 2 | |||
| Category of Advertisement | Frequency | Relative Freq | Frequency | Relative Freq. |
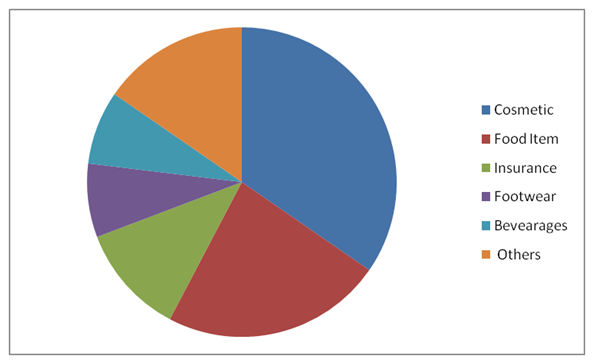
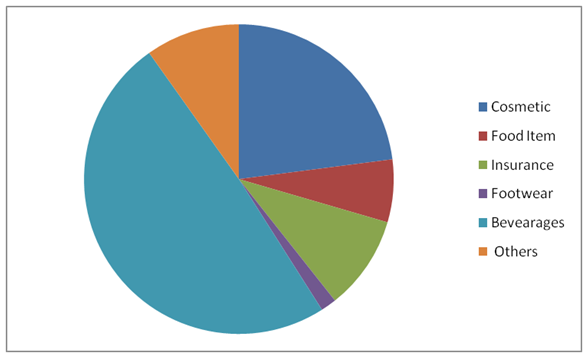
| cosmetic | 9 | 0.3462 | 14 | 0.4118 |
| Food Items | 6 | 0.2308 | 4 | 0.1176 |
| Insurance | 6 | 0.1154 | 6 | 0.1765 |
| Foot Bear | 2 | 0.0769 | 1 | 0.0294 |
| Beverages | 2 | 0.0769 | 3 | 0.8824 |
| Other | 4 | 0.1538 | 6 | 0.1765 |
Displaying Qualitative Data
Graphic 1:
1. Create a pie chart reflecting the categories of articles for Magazine 1.
2. Create a pie chart reflecting the categories of articles for Magazine 2
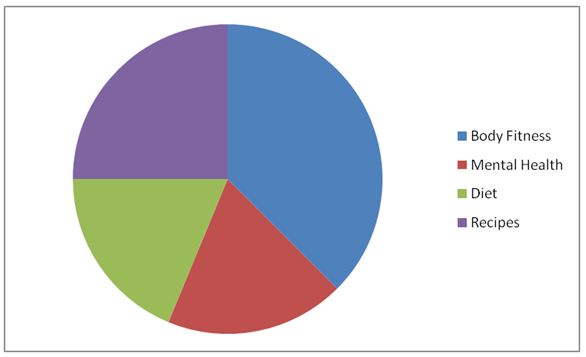
Pie chart Analysis:
The pie chart shows the share of each category out of 360 in terms of relative frequency. The more the relative frequency is the more is the share in the pie chart for that category. We can compare the charts in terms of share for a particular category. Pie charts show which category has more share compared to the other.
Graphic 2:
Since the data is categorical the bar chart can be used to compare the two magazines.
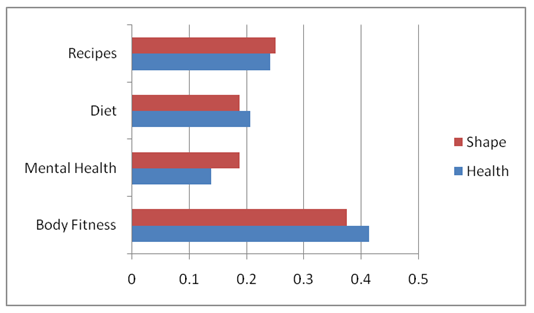
Graphic 2 Analyses:
The second graph compares each category with respect to relative values as these values are side by side for each category. Hence it becomes easier to compare. When we look at the graph they appear almost the same for each category i.e. the bar for each category is almost the same with slight deviations. This kind of graphics cannot be used to find causal-effect relationships and other summary statistics. Other than this Bar Charts are best suitable for comparison.
Summarizing the Results
The magazine Shape has done a better job to make it more appealing by using different types of graphics and pictorial representation. Magazines are looking to target the Young generation by using articles which are more attractive to this age people. The advertisements are also well selected and placed to be appealing. The magazines have used the strategy to place advertisements related to articles.
Wrap Up
Q: How much time did you spend on this Magazine assignment? How did this assignment go for you? Did you find it hard to get into at first, or did you find it pretty comfortable to do? What part of it was interesting to you?
It took a lot of time to the selection of two related magazines and find the issue of the same month and year. After that extracting information took three days. The assignment has given me a chance to thoroughly analyze and compare two magazines and critically examine their advertisement strategy. The hard part of this assignment was the selection of magazines but the statistical analysis was easy and interesting. The most interesting part of the assignment was looking at the advertisements and finding out that the categories of advertisements match the categories of articles. The advertisements in whole magazines were similar to articles in terms of categories.