Finding Probabilities and Hypothesis Testing
The following solutions are based on an ample mix of concepts of probability and statistics. While some are hinged on inferential statistics, others are associated with probability concepts. Each solution is original and correct. You can bank on them for seamless revision with easy understanding.
Giving Examples of Discrete and Continuous Variables
1. Give an example of a
a) Discrete random variable
The number of cancer patients in the US in a specified year
b) Continuous random variable
The time that patients need to survive from a specific disease
Finding Probabilities
2. I have devised a “Duck Test” using my patented “Duck-o-meter” to reveal secret Duck (University of Oregon) fans on campus. Suppose my test has 93% sensitivity and 97% specificity. Also, suppose that 1 out of every 100 students on campus are secret Duck fans,
a) What is the chance that a student who tests positive for Duck fan status is actually a secret Duck fan?
Let p=tests positive, n=tests negative, D= Duck fan. Then given that P(P|D) = 0.93, P(N| Not D) =0.97 and P(D) = 0.01. Here we want to find P(D|P). This can be found using Baye’s theorem.
P(D|P)=((P(p│D)P(D))/(P(p│D)P(D)+P(p│D^' )P(D^' ) )=(0.93*0.01)/(0.93*0.01+0.03*0.99)=0.2385
b) Why does the test perform so poorly given the relatively high sensitivity and specificity levels?
Due to less prevalence.
3. A random sample of nT=25 individuals with high blood pressure (BP) is given a new blood pressure drug, and another sample of nC=25 individuals is given a placebo. Suppose that for the treatment group the average diastolic blood pressure is x ̅_T=165 with s_T=10 and for the placebo group, x ̅_C=180and s_C=11.5.
a) Find a 95% C.I. for mean blood pressure for both groups.
180±t_25 11.5/√50
180+c(-1,1)*25*11.5/sqrt(50)
[1] 139.3414 220.6586
165±t_25 10/√50
156+c(-1,1)*25*10/sqrt(50)
[1] 120.6447 191.3553
b) Explain these confidence intervals in words.
We are 95% confident that the true mean blood pressure for the control group lies between 139.3414 and 220.6586. Also, we are 95% confident that the true mean blood pressure for the treatment group lies between 120.6447 and 191.3553.
c) Is the average BP for the treatment group lower than that of the control groups?
No, as the confidence intervals overlap.
d) What are the assumptions used here? Are they reasonable?
Assumptions are that the population follows a normal distribution.
The Central Limit Theorem
4. Explain the Central Limit Theorem in your own words.
The central limit theorem is that if we have a population with mean μ and standard deviation σ and take sufficiently large samples randomly from the population with replacement, then the distribution of the sample means will be normally distributed.
Probability Distribution Solutions
5. Seven patients walk into a doctor’s office. There is a 25% chance that each individual will seek high blood pressure (BP) treatment.
Note: If X~Bin(n=7,p=0.25), then,
| X | 0 | 1 | 2 | 3 | 4 | 5 | 6 | 7 |
| P(X) | 0.25 | 0.311 | 0.311 | 0.173 | 0.058 | 0.012 | 0.001 | 0.000 |
a) What is the probability that 3 individuals seek high BP treatment? Write out the Binomial equations for your answer and give the final numerical answer.
P(3)=(7¦3) 〖0.25〗^3 〖0.75〗^4=35*〖0.25〗^3 〖0.75〗^4=0.173
P(3)=(7¦3) 〖0.25〗^3 〖0.75〗^4=35*〖0.25〗^3 〖0.75〗^4=0.173
b) What is the probability that 5 or fewer individuals will seek high BP treatment? Write out the Binomial equations for your answer and give the final numerical answer.
P(X≤5)=1-P(X>5)=1-P(X=6)-P(X=7)=1-0.001=0.999
c) What is the probability that 7 or fewer individuals will seek high BP treatment? Simply write the numerical answer here.
1
d) What assumptions did you make here to use the Binomial distribution? Are these assumptions valid?
All the events are independent and have the same probability of success.
Finding Conditional Probabilities
6. Suppose I take a sample of size 100 from OSU students and obtain their average height. Suppose that the mean height of all OSU students is 69 inches with a standard deviation of 12 inches. What is the probability that my sample average will be above 70 inches?
If x ̅ is the sample average then it follows a normal distribution with a mean of 69 inches and a standard deviation of 12/√100=1.2inches. Thus the probability that the sample average will be above 70 inches is P(x ̅>70)=P((x ̅-69)/1.2>(70-69)/1.2)=P(Z>1/1.2)=0.2023
7. Observe the following data that show the relationship between hay fever and eczema at age 11 for a group of sick children (taken from “An Introduction to Medical Statistics”, by Martin Bland.)
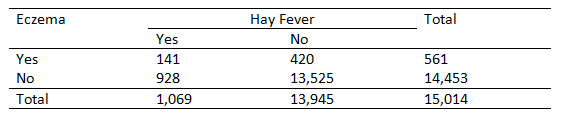
a) What is the probability that a randomly selected child has both hay fever and eczema?
141/15014 = 0.0094
b) What is the probability that a randomly selected child has neither hay fever nor eczema?
13525/15014 = 0.901
c) What is the probability that a randomly selected child has either hey fever or eczema?
(1069+561-141)/15014 = 0.099
d) What is the probability that a child randomly selected from those with hey fever will also have eczema?
141/1069=0.131
e) What is the probability that a child randomly selected from those with eczema will have hay fever?
141/561=0.25