Using Pearson correlation for data analysis
Here, we will use Pearson correlation using SAS to analyze the impact of COVID-19 on business. We will also use ANOVA to compare the impact in different countries.
Question
Please select a dataset with data on any of the subjects on the pdf file attached. Once you choose which large data you want to go with, save the data. Here are the requirements of the paper:
1. Once you select a date, please state the business problem this dataset can address.
2. State the Description of the business problem including the organization’s strategic goals.
3. Next, please create a SAS program to create a dataset containing only the variables you need for your analyses, thus filtering out any unnecessary data from your analysis work.
4. State a Description of the variables in the SAS dataset created.
5. Create a minimum of 4 business questions that, if answered, will solve the business problem. List, at a minimum, the 4 business questions. Justify how these business questions will solve the business problem. Explain why you selected those specific business questions.
6. Create the alternate and null hypotheses for each business question. The business questions and hypotheses will become the primary framework for your assignment. List the alternate and null hypotheses for each business question.
7. Which statistical tests do you intend to conduct or use and why? How will these tests answer the business questions and prove or disprove your hypotheses?
8. Which visualizations do you intend to use and why? Why are these visualizations the best formats for communicating the story the data is telling us?
9. Your analysis should include the necessary descriptive analytics tests to communicate your understanding of what story the data is telling us.
10. Descriptive statistics should include charts, graphs, tables, business insights, and the story the data is telling us
11. Also, your analysis should include the necessary predictive analytics tests to
assist decision-makers in achieving their business goal of future business growth.
12. Predictive statistics to include charts, graphs, tables, business insights, and the story the data is telling us.
13. Provide an Analysis of findings with respect to business questions and hypotheses.
14. Provide Recommendations for further analysis: what other data sources, including big data sources, could the organization utilize to help them achieve their business goals?
15. Limit the charts, graphs, and tables in your analysis report to only those figures needed to support your findings and analysis. Do not include statistics outputs that are not relevant to your analysis. Your analysis report should be comprehensive yet concise, specific, and most importantly, insightful.
Solution
In this study, the dataset is chosen for the business strategy problem according to the situation. The four problems are created by using the dataset and answering them respectively. The question is the following: The severity of governmental reactions has varying degrees of rigor. Because the uniqueness of both the limits themselves and its particular cultural and political circumstances, comparing the superior effectiveness of multinational remedies has proven difficult. We want to see if, as expected, stricter reactions are more successful than lenient ones in lowering exercised by looking at stringency indicators, case numbers, and expected GDP increases in nations through similarities as well as different conditions. Similarly, we look into whether harsher reactions do fact cause more economic harm. The analysis gives evidence for the decision on future stringency as governments try to balance financial and societal health in the face of the expected, and real, "second phase" of diseases. The goal of this article is to simulate the impact of COVID-19 fatality per population (CMP), a proxy for COVID-19, on GDP per capita per COVID-19 instance.
The Human Development Index (HDI) is one of the variables that can have an impact on GDP (GDP). The Human Development Index can be used to assess a country's progress in various areas, including health, education, and living standards. We're interested in seeing what the relationship is between GDP and HDI.
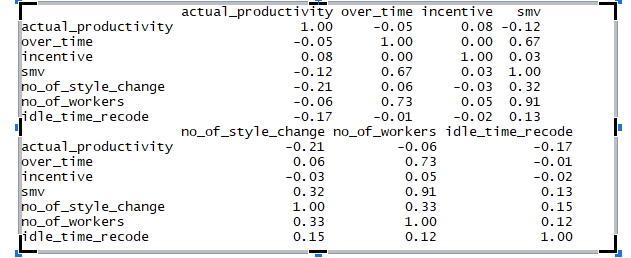
According to the Pearson correlations, there was a substantial positive relationship between HDI years and GDP r(44215) =.7267, p.001). The HDI places a larger focus on social progress than the GDP.
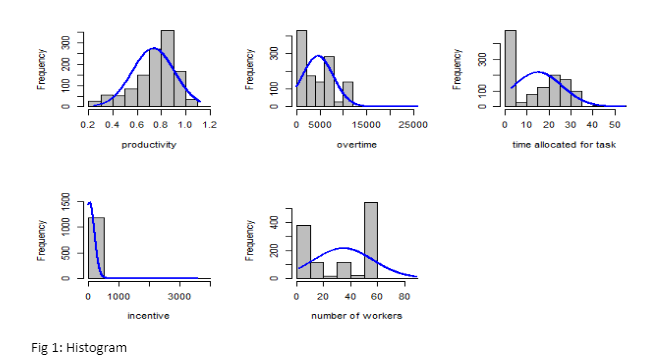
Figure 1
This suggests that HDI and GDP have a favorable association. The GDP values tend to rise when the HDI values rise (move right).
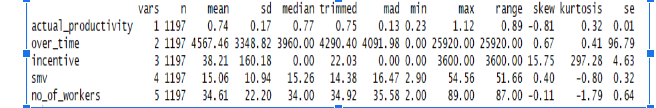
The above results showed the descriptive statistics of the variables. Also, describe it's mean and variances. The mean for the variable GDP (M = 20818.7062, SD = 20441.3654).
Hypothesis:
Ho: GPD = 0
Ha: GDP ≠ 0
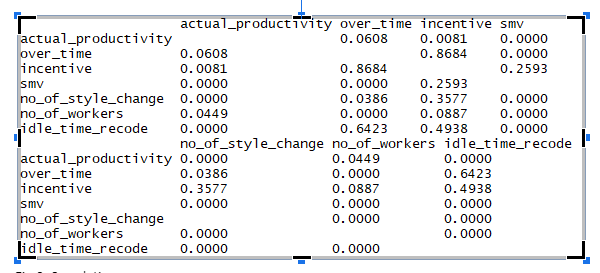
According to output 1, the significance level is 215.341, indicating that the null hypothesis is rejected with a 0.000 chance of less than 0.05 percent. This demonstrates that GDP and HDI have a highly substantial relationship. As a result, the alternative hypothesis can be accepted. Only 52.81 percent of GDP was explained by HDI in this model, according to the R2 of 0.5281.
The above results showed the descriptive statistics of the variables. Also, describe it's mean and variances. The mean for the variable GDP (M = 0.7201, SD = 0.1609)
Hypothesis:
H0: HDI = 0
Ha: HDI ≠ 0
According to output 2, the calculated t - value is 941.12 and shows that the null hypothesis is rejected by a 0.000 chance of less than 0.05 percent. This demonstrates that GDP and HDI have a highly substantial relationship. As a result, the alternative hypothesis can be accepted. Only 52.81 percent of GDP was explained by HDI in this model, according to the R2 of 0.5281.
This curve implies that there are a lot of data values that are higher than the mean, possibly outliers. Left-Skewed: A left-skewed distribution has a peak to the right of the center, falling to the left side relatively gradually. As a result, the histogram plainly shows that it has a peak mostly on the right-hand side, indicating that the HDI variable's distributions are negative.
This pattern implies that there are a lot of data points that are higher than the mean, possibly outliers. Right-Skewed: A right-skewed histogram does have a peak to the left of the center, falling to the right side more slowly. As a result, the histogram plainly shows that it has a peak on the left side, indicating that the GDP variable's distribution is positive and right-tailed.
Relationship between stringency index and GDP
A linear regression analysis was used to see if age had any bearing on the Stringency index and GDP. The regression results showed that the model described 1.19 percent of the variation and that it was statistically significant F(1,35672)=430.26, p.0001. Stringency index was found to be significantly predicted by age (1 = 185.81, p.0001). GDP = 203.58 + -.153*Stringency index was the final forecasting model.
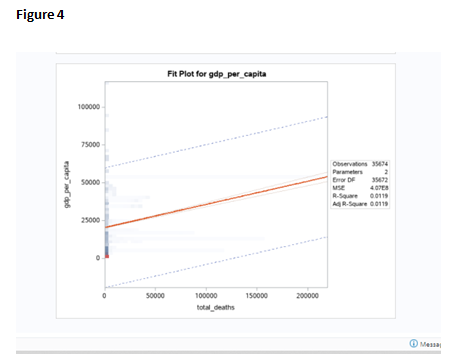
The linear association between the stringency index and GDP was depicted in the scatter plot. It demonstrates the existence of a positive linear relationship between variables.
Regression for GDP and human development index COVID-19
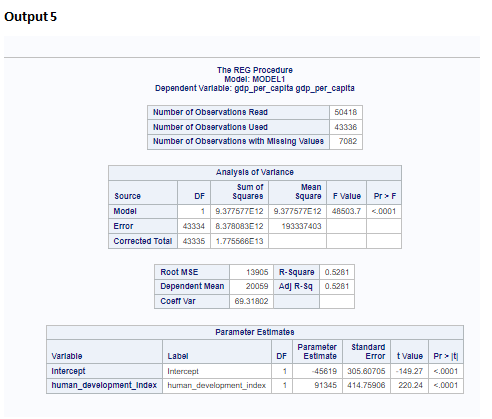
A simple linear regression was used to see if age had any bearing on the Stringency index and GDP. The regression results showed that the model explained 1.19 percent of the variation and that it was statistically significant F(1,43334)=48503.7, p<0001. GDP was found to be strongly predicted by age (1 = 185.81, p.0001). GDP = -45619 +91345*HDI was the final forecasting model.
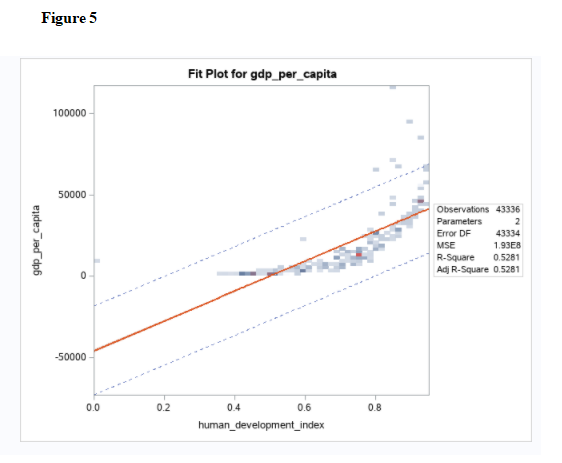
The scatter plot depicted a linear link between GDP and the COVID-19 human development index. It demonstrates the existence of a positive linear relationship between variables.
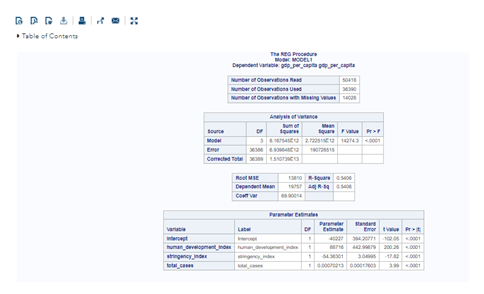
Multiple regression GDP as the dependent variable
To forecast GDP using HDI, stringency index, and total cases, a multiple regression was used. These variables statistically substantially predicted GDP, F(3,36386) = 14274.3, p.0001, R2 =.5406. The addition of all three variables to the forecast was statistically significant, with a p-value of.05.
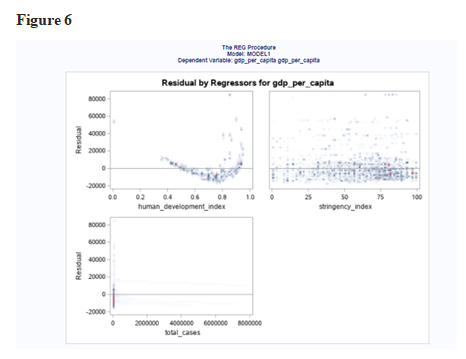
Output 6
The scatter element includes the relationship between each multiple strain. Let's look at the scatter matrix for the matrix below:
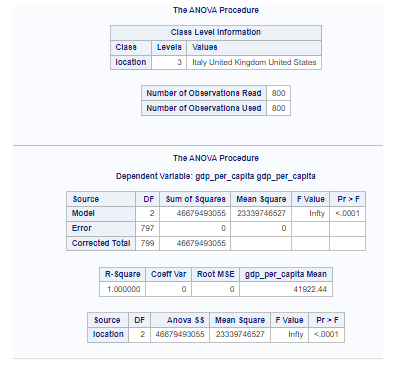
ANOVA for the comparison of GDP of Italy, US, and the UK
- H0: μ1 = μ2 = μ3 = μ4
- H1: Means are not all equal.
F0.05(2,797) = infinity with a value of 0.05. We reject the hypothesis of equal population means since the test statistic is significantly bigger than the critical value, and we conclude that there is a (statistically) significant difference between the population means. The test statistic is significant at that level since the p-value for infinity is 0.0001.
Conclusion
This study revealed that the HDI has long-term correlations with GDP. In the long run, HDI and GDP have a positive association. In the short term, stringency has a higher impact on GDP than transmission, demonstrating that the timing of the response is more important than the severity of the response.
Recommendation
The study uses only one source for the analysis to encounter problems in business. According to big data, Big data can be used by firms to spot a variety of customer-related trends and patterns. In order to induce loyalty, it is necessary to observe client behavior. In theory, the more data a corporation collects, the more patterns and trends it will be able to spot. Every business, no matter how big or little, requires useful data and insights. When it comes to gaining a better understanding of your target audience and client preferences, big data is crucial. It even assists you in anticipating their requirements. The right data must be presented and analyzed efficiently. It can assist a company in achieving a variety of objectives.