Problem Description:
The aim of this SPSS homework is to conduct a statistical analysis to examine the impact of different methods of note-taking on test scores. Two types of notes were compared: "Notes with a laptop" and "Written notes." We assessed the presence of outliers, formulated null and research hypotheses, determined the appropriate measures of central tendency, used SPSS for data analysis, calculated effect size, and provided a rationale for our chosen analysis.
Solution
Part A:
| Type of notes | Mean | Std Dev | Mean-3*SD | Mean+3*SD | Min | Max |
|---|---|---|---|---|---|---|
| Notes with a laptop | 76.9524 | 13.05173 | 37.79721 | 116.1076 | 45 | 95 |
| Written notes | 82.4286 | 16.58485 | 32.67405 | 132.1832 | 27 | 100 |
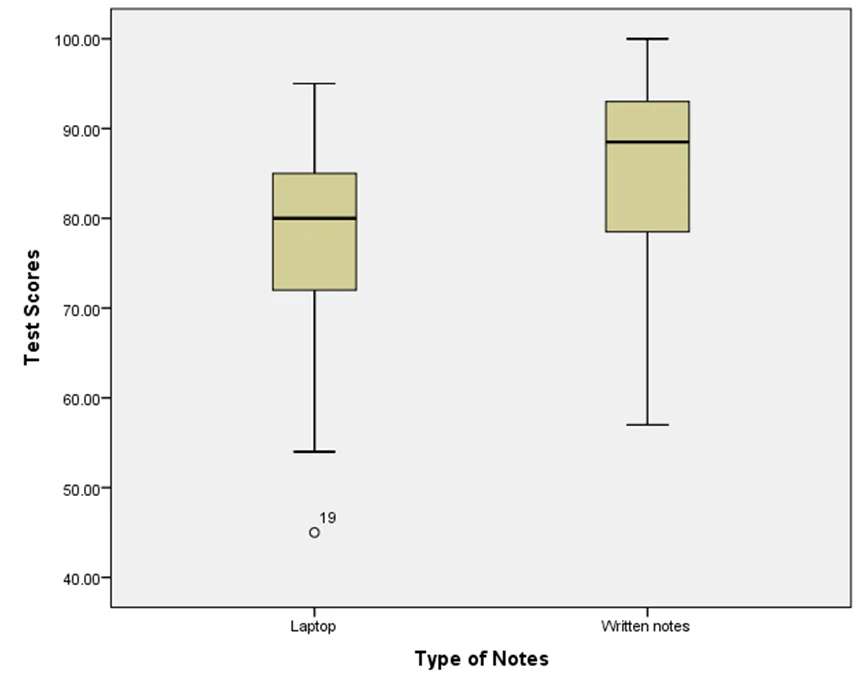
The minimum value of the scores for “notes with a laptop” is larger than “Mean-3*SD” while the maximum value of the scores for “notes with a laptop” is smaller than “Mean+3*SD”. Thus, there are not outliers in this data.
However, the minimum value of the scores for “written notes” is smaller than “Mean-3*SD” while the maximum value of the scores for “written notes” is smaller than “Mean+3*SD”. Thus, there are outliers on the lower side of this data. Closer examination of the data shows that there is one outlier in the data and it is removed from the data.
1. State your null & research hypotheses:
Null hypothesis: There is no statistically significant difference in test scores for those who took written notes (IV level 2) compared to those who took notes with a laptop (IV level 1) that was not connected to the internet
Research hypothesis: There exists a statistically significant difference in test scores for those who took written notes (IV level 2) compared to those who took notes with a laptop (IV level 1) that was not connected to the internet
2. State the appropriate measure of central tendency for each variable:
Mean is the appropriate measure of central tendency for test scores and it is 80.98 for the entire data.
Mode is the appropriate measure of central tendency for type of notes and it is took notes with a laptop (IV level 1) that was not connected to the internet since we removed one data value for “written notes”.
3. Copy and Paste your SPSS output:
| Group Statistics | |||||
|---|---|---|---|---|---|
| Type of Notes | N | Mean | Std. Deviation | Std. Error Mean | |
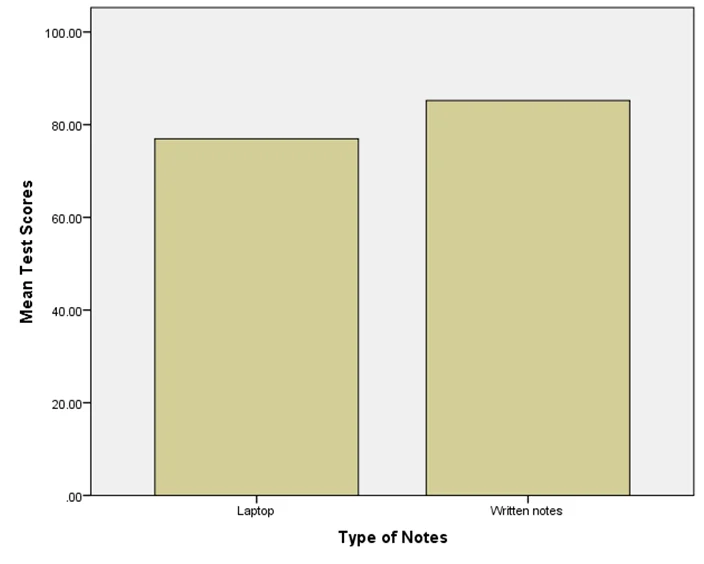
| Test Scores | Laptop | 21 | 76.9524 | 13.05173 | 2.84812 |
| Written notes | 20 | 85.2000 | 10.94291 | 2.44691 | |
| Independent Samples Test | ||||||||||
|---|---|---|---|---|---|---|---|---|---|---|
| |
Levene's Test for Equality of Variances | t-test for Equality of Means | ||||||||
| F | Sig. | t | df | Sig. (2-tailed) | Mean Difference | Std. Error Difference | 95% Confidence Interval of the Difference | |||
| Lower | Upper | |||||||||
| Test Scores | Equal variances assumed | .193 | .663 | -2.187 | 39 | .035 | -8.24762 | 3.77130 | -15.87580 | -.61944 |
| Equal variances not assumed | -2.197 | 38.399 | .034 | -8.24762 | 3.75488 | -15.84639 | -.64885 | |||
4. Include any additional statistics (e.g., effect size) appropriate for this analysis:
- Note: You may need to calculate some statistics yourself, if not provided by SPSS.
Cohen’s d = (85.2-76.9524)/√((13.0522+10.9432)/2)
= 0.685
5. Give a rationale for why you needed to use this specific analysis for this study:
The test score, a scale variable, is the dependent variable. It is being compared for the two groups: for those who took written notes (IV level 2) and those who took notes with a laptop (IV level 1) that was not connected to the internet and thus, is a nominal variable. Since we are comparing the test scores for binary coded variable, independent samples t-test is used. And since we are comparing whether test scores are same or differ across two groups, it is a two-tailed test.
6. Using APA style, write up your procedure & results sections in two separate paragraphs – like in your textbook:
Procedure:
The participants were randomly selected in the sample from the university. The students in the university were asked to view an hour long pre-recorded video lecture showing 100 different ways to cook pasta. They were randomly assigned to take notes either using a laptop without internet connection or by hand. In each, 21 students were selected. After 10 minutes of their watching the video, they were tested with 200 ways to cook pasta and were asked to indicate the 100 that were included in the video.
Results:
An independent-samples t-test was conducted to compare test scores for those who took written notes and to those who took notes with a laptop that was not connected to the internet. There was a significant difference in the scores for those who took written notes (M=85.2, SD=10.94) and for those who took notes with a laptop that was not connected to the internet conditions (M=76.95, SD=13.05); t(39)=-2.187, p <0.05, Cohen’s d=0.69.
Part B:
| Type of notes | Mean | Std Dev | Mean-3*SD | Mean+3*SD | Min | Max |
|---|---|---|---|---|---|---|
| Laptop without internet | 76.9524 | 13.05173 | 37.79721 | 116.1076 | 45 | 95 |
| Written notes | 85.2 | 10.943 | 52.371 | 118.029 | 27 | 100 |
| Laptop with internet | 70.9524 | 11.8764 | 35.3232 | 106.5816 | 48 | 91 |
The minimum value of the scores for “notes with a laptop with internet” is larger than “Mean-3*SD” while the maximum value of the scores for “notes with a laptop with internet” is smaller than “Mean+3*SD”. Thus, there are not outliers in this data.
1. State your null & research hypotheses:
Null hypothesis: There is no statistically significant difference in test scores for those who took written notes (IV level 2), those who took notes with a laptop (IV level 1) that was not connected to the internet and those who took notes with a laptop that has internet.
Research hypothesis: There test scores were statistically significant for one of the pairs from those who took written notes (IV level 2), those who took notes with a laptop (IV level 1) that was not connected to the internet and those who took notes with a laptop that has internet.
2. State the appropriate measure of central tendency for each variable:
Mean is the appropriate measure of central tendency for test scores and it is 77.58 for the entire data.
Mode is the appropriate measure of central tendency for type of notes and it is bimodal with modal value of took notes with a laptop (IV level 1) that was not connected to the internet and those who took notes with a laptop that has internet since we removed one data value for “written notes”.
3. Copy and Paste your SPSS output:
Descriptives
Test Scores
| |
N | Mean | Std. Deviation | Std. Error | 95% Confidence Interval for Mean | Minimum | Maximum | |
|---|---|---|---|---|---|---|---|---|
| Lower Bound | Upper Bound | |||||||
| Laptop without internet | 21 | 76.9524 | 13.05173 | 2.84812 | 71.0113 | 82.8935 | 45.00 | 95.00 |
| Written notes | 20 | 85.2000 | 10.94291 | 2.44691 | 80.0786 | 90.3214 | 57.00 | 100.00 |
| Laptop with internet | 21 | 70.9524 | 11.87635 | 2.59163 | 65.5463 | 76.3584 | 48.00 | 91.00 |
| Total | 62 | 77.5806 | 13.17915 | 1.67375 | 74.2338 | 80.9275 | 45.00 | 100.00 |
| Levene Statistic | df1 | df2 | Sig. |
|---|---|---|---|
| .099 | 2 | 59 | .906 |
ANOVA
Test Scores
| Sum of Squares | df | Mean Square | F | Sig. | |
|---|---|---|---|---|---|
| Between Groups | 2091.992 | 2 | 1045.996 | 7.258 | .002 |
| Within Groups | 8503.105 | 59 | 144.120 | ||
| Total | 10595.097 | 61 |
4. Include any additional statistics (e.g., effect size) appropriate for this analysis:
- Note: You may need to calculate some statistics yourself, if not provided by SPSS.
Effect size = SSbetween/SStotal = 2091.992/10595.097=0.197
5. Give a rationale for why you needed to use this specific analysis for this study:
The test score, a scale variable, is the dependent variable. It is being compared for the three groups: for those who took written notes (IV level 2) , those who took notes with a laptop (IV level 1) that was not connected to the internet and those who took notes with a laptop (IV level 3) with internet and thus, is a nominal variable. Since we are comparing the test scores for a nominal variable with three categories, one-way ANOVA is used. And since we are comparing whether test scores are same or differ across three groups, it is a two-tailed test.
6. Using APA style, write up your procedure & results sections in two separate paragraphs – like in your textbook:
Procedure:
The participants were randomly selected in the sample from the university. The students in the university were asked to view an hour long pre-recorded video lecture showing 100 different ways to cook pasta. They were randomly assigned to take notes by hand or by using a laptop with or without internet connection. In each, 21 students were selected. After 10 minutes of their watching the video, they were tested with 200 ways to cook pasta and were asked to indicate the 100 that were included in the video.
Results:
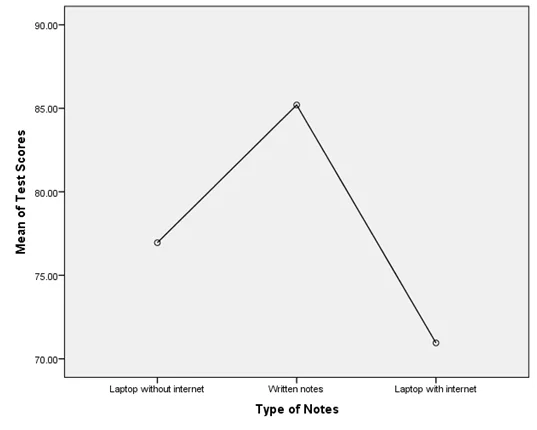
A one-way ANOVA was conducted to compare test scores for those who took written notes, to those who took notes with a laptop that was not connected to the internet and to those who took notes with a laptop that was connected to the internet. There was a significant effect of taking notes by hand or using laptop with or without internet on test scores at the p<.05 level for the three conditions [F(2,59) = 7.258, p = 0.002, ή2=0.20]. Post hoc comparisons using the Tukey HSD test indicated that the mean test score for taking notes by hand (M = 85.20, SD = 10.94) was significantly different than taking notes with laptop with internet (M = 70.95, SD = 11.88). However, test scores for taking notes using laptop without internet (M = 76.95, SD = 13.05) was not significantly different than from taking notes by hand and laptop with internet.